Events & Promotions
|
|

GMAT Club Daily Prep
Thank you for using the timer - this advanced tool can estimate your performance and suggest more practice questions. We have subscribed you to Daily Prep Questions via email.
Customized
for You
Track
Your Progress
Practice
Pays
Not interested in getting valuable practice questions and articles delivered to your email? No problem, unsubscribe here.
 Jun 08
08:00 PM EDT
-10:00 PM EDT
Master the GMAT with expert live instruction, a personalized study plan, and real-time support. Includes 40 hours of online classes plus 6 months of access to the TTP GMAT OnDemand video course. Mon/Wed June 8, 2026 →August 12, 2026 8:00pm-10:00pm EST Jun 10
06:00 AM PDT
-06:15 PM PDT
Register for the GMAT Club Virtual MBA Spotlight Fair – the world’s premier event for serious MBA candidates. This is your chance to hear directly from Admissions Directors at nearly every Top 30 MBA program..- Jun 10
10:00 AM PDT
-11:00 AM PDT
Scoring 715 on the GMAT Focus Edition requires more than just learning formulas, memorizing concepts, or solving hundreds of questions. In this episode, Nishant shares how he improved his GMAT preparation by focusing on application of concepts, and more.  Jun 11
11:00 AM EDT
-01:00 PM EDT
TTP GMAT OnDemand gives serious students 400+ hours of expert video instruction, the full TTP course, AI support, weekly office hours, and a 715+ score guarantee—all built for elite GMAT score improvement.


Can be
inferred
as true: If the researchers' projections are accurate, the island's seabird population is likely to increase during more years of the second study than it did in the first. Can be
inferred
as false: During the first study, the island's seabird population decreased only when the island's domesticated cat population increased.
inferred
as true: If the researchers' projections are accurate, the island's seabird population is likely to increase during more years of the second study than it did in the first. Can be
inferred
as false: During the first study, the island's seabird population decreased only when the island's domesticated cat population increased.
Be sure to select an answer first to save it in the Error Log before revealing the correct answer (OA)!
Difficulty:
 95%
(hard)
95%
(hard)
Question Stats:
25% (03:04) correct 75%
(03:23)
wrong
based on 1986
sessions
75%
(03:23)
wrong
based on 1986
sessions
History
Date
Time
Result
Not Attempted Yet
In a study conducted over several years, seabird and domesticated cat populations on a geographically isolated island changed from year to year. Researchers found that over the course of the study, the relationship (R) between seabirds and domesticated cats was such that the island's seabird population was three times as likely to decrease from the previous year if the island's domesticated cat population increased (even if slightly) during the same year. The researchers are about to begin a second, follow-up study with the same duration as the first study. Based on recent trends, the researchers made the following projections: R will hold and the island's domesticated cat population will decrease during more years of the second study than it did in their first study.
Assuming that the information above is true, select for Can be inferred as true the statement that can be most reasonably inferred as true from the information provided, and select for Can be inferred as false the statement that can be most reasonably inferred as false from the information provided. Make only two selections, one in each column.
Assuming that the information above is true, select for Can be inferred as true the statement that can be most reasonably inferred as true from the information provided, and select for Can be inferred as false the statement that can be most reasonably inferred as false from the information provided. Make only two selections, one in each column.
ID: 700201
|
Can be inferred as true |
Can be inferred as false |
|
| If the researchers' projections are accurate, the island's seabird population is likely to increase during more years of the second study than it did in the first. | ||
| During the first study, most years had an increase in the island's domesticated cat population. | ||
| If the researchers' projections are accurate, the island's seabird population is likely to increase during most of the years of the second study. | ||
| During the first study, the island's seabird population decreased only when the island's domesticated cat population increased. | ||
| During the first study, most years during which the island's seabird population decreased were years during which the island's domesticated cat population increased. |
ShowHide Answer
Official Answer
Can be
inferred
as true: If the researchers' projections are accurate, the island's seabird population is likely to increase during more years of the second study than it did in the first. Can be
inferred
as false: During the first study, the island's seabird population decreased only when the island's domesticated cat population increased.
inferred
as true: If the researchers' projections are accurate, the island's seabird population is likely to increase during more years of the second study than it did in the first. Can be
inferred
as false: During the first study, the island's seabird population decreased only when the island's domesticated cat population increased.

savalt
I would easily classify this question as Hard. A fair bit of struggle involved because of the long statements and complicated relations and comparisons.
Bird and cat pops changed from year to year (so they were not constant. We assume that they changed every year)
Given R: If cat pop increased, probability of bird pop decreasing became 3 times.
So even if cat pop decreases, there is a pobability that bird pop will also decrease (albeit smaller).
Predictions:
- R will hold
- Cat pop will decrease during more years of the second study than it did in their first study
(IMPORTANT POINT - COMPARISON between first study and second study, not between the number of years of increase/decrease in either one study alone)
Now we choose for "Can be inferred to be true" and "Can be inferred to be false"
If the researchers' projections are accurate, the island's seabird population is likely to increase during more years of the second study than it did in the first.
Predictions are accurate. We know that in second study, cat pop will decrease in more years than in first study.
So the cat pop will increase or stay the same in fewer years in the second study than in the first study. The probability of bird pop decreasing becomes much greater (3 times) in these years, and there will be fewer of these years. So, we are likely to see fewer years of bird pop decreasing in second study than in first study. So we are likely to see more years of bird pop increasing in second study than in first study.
The word "likely" gives me a lot of confidence in this option. ANSWER
During the first study, most years had an increase in the island's domesticated cat population.
As we said before, we do not know how the split was between "no of years of cat pop increases" and "no of years of cat pop decreases" in the first study. There is no such comparison given.
If the researchers' projections are accurate, the island's seabird population is likely to increase during most of the years of the second study.
As we said before, we do not know how the split was between "no of years of bird pop increases" and "no of years of bird pop decreases" in the first study and hence nothing can be said about second study either. There is no such comparison given.
During the first study, the island's seabird population decreased only when the island's domesticated cat population increased.
We know that there is a probability of bird pop decreasing even when cat pop decreases. That probability is not 0. It becomes 3 times when cat pop increases. Hence we know that "cat pop increase" is not necessary for "bird pop decrease". ANSWER
Hence this statement can be inferred to be false.
During the first study, most years during which the island's seabird population decreased were years during which the island's domesticated cat population increased.
Cannot say whether it is true or false. It is natural that it could be true but it could be false also. e.g. what if out of 20 years of first study, in 18 years cat pop decreased and in 2 years cat pop increased. Out of those 18 years, bird pop decreased in 6 years but in both years of cat pop increase, bird pop decreased. This is possible.
General Discussion


Kudos
Bookmarks
Given 1) Relation R - During the first study, SB was 3x as likely to decrease if Cat increased. This means if there were x years when the Cat population decreased AND the SB population decreased, then there were 3x years when the cat population increased AND SB decreased.
2) year to year changes, so only increase or decrease possible.
3) Second study has same no of years and R will hold.
4) More no of years with cat population decreasing.
Now, while I agree that option D MUST BE FALSE, I initially thought it is not correct that A must be true.
One example I came up with to show this ->
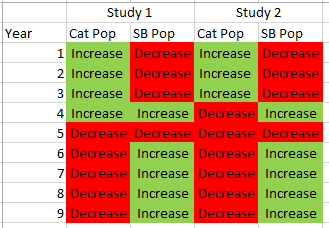
On thinking a little deeper, I now don't agree with the red highlighted part in my statement 1 at the top. Rather I feel that the likelihood of SB decrease if Cat increase is linked to no of years with Cat increase & SB decrease divided by no of years with cat increase or in study 1 (3/4) and not simply 3 as I was initially assuming.
Just posting this for someone who might have been thinking along the same lines as I was initially.

GMAT-Club-Forum-uymyj5th.png [ 7.14 KiB | Viewed 7896 times ]
2) year to year changes, so only increase or decrease possible.
3) Second study has same no of years and R will hold.
4) More no of years with cat population decreasing.
Now, while I agree that option D MUST BE FALSE, I initially thought it is not correct that A must be true.
One example I came up with to show this ->
On thinking a little deeper, I now don't agree with the red highlighted part in my statement 1 at the top. Rather I feel that the likelihood of SB decrease if Cat increase is linked to no of years with Cat increase & SB decrease divided by no of years with cat increase or in study 1 (3/4) and not simply 3 as I was initially assuming.
Just posting this for someone who might have been thinking along the same lines as I was initially.
Attachment:
GMAT-Club-Forum-uymyj5th.png [ 7.14 KiB | Viewed 7896 times ]