Events & Promotions
|
|

GMAT Club Daily Prep
Thank you for using the timer - this advanced tool can estimate your performance and suggest more practice questions. We have subscribed you to Daily Prep Questions via email.
Customized
for You
Track
Your Progress
Practice
Pays
Not interested in getting valuable practice questions and articles delivered to your email? No problem, unsubscribe here.
- Nov 20
07:30 AM PST
-08:30 AM PST
Learn what truly sets the UC Riverside MBA apart and how it helps in your professional growth - Nov 20
11:00 AM EST
-11:59 PM EST
Don’t miss Target Test Prep’s biggest sale of the year! Grab 25% off any Target Test Prep GMAT plan during our Black Friday sale. Just enter the coupon code BLACKFRIDAY25 at checkout to save up to $625. - Nov 22
11:00 AM IST
-01:00 PM IST
Do RC/MSR passages scare you? e-GMAT is conducting a masterclass to help you learn – Learn effective reading strategies Tackle difficult RC & MSR with confidence Excel in timed test environment - Nov 22
12:00 PM PST
-12:30 PM PST
olve GRE practice problems covering Quantitative reasoning, Verbal Reasoning, Text Completion, Sentence Equivalence, and Reading Comprehension Problems. Take this GRE practice quiz live with peers, analyze your GRE study progress, - Nov 23
10:00 AM PST
-11:00 AM PST
GMAT practice session and solve 30 challenging GMAT questions with other test takers in timed conditions, covering GMAT Quant, Data Sufficiency, Data Insights, Reading Comprehension, and Critical Reasoning questions. - Nov 23
11:00 AM IST
-01:00 PM IST
Attend this free GMAT Algebra Webinar and learn how to master the most challenging Inequalities and Absolute Value problems with ease. - Nov 30
10:00 AM EST
-11:59 PM EST
Get $325 off the TTP OnDemand GMAT masterclass by using the coupon code BLACKFRIDAY25 at checkout. If you prefer learning through engaging video lessons, TTP OnDemand GMAT is exactly what you need.
Dropdown 1: 55
Dropdown 2: Z
Be sure to select an answer first to save it in the Error Log before revealing the correct answer (OA)!
Difficulty:
 75%
(hard)
Question Stats:
56% (02:16) correct 44%
(02:46)
wrong
  based on 3062
sessions
History
Date
Time
Result
Not Attempted Yet
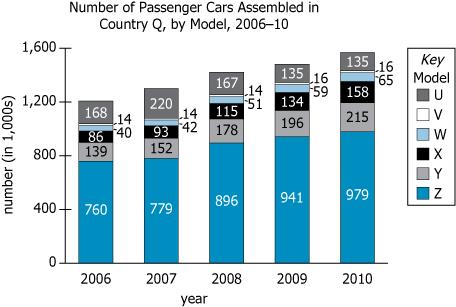
In Country Q, 6 different models of passenger automobiles are assembled. The graph shows the number of each model assembled, in thousands, for each of the years 2006–2010.
Select the option from each drop-down menu that creates the most accurate statement based on the information provided.
Rounded to the nearest 5 percent, the number of Model Y cars assembled in Country Q increased by percent from 2006 to 2010.
From 2007 to 2008, the increase in the number of cars assembled in Country Q was greatest for Model .
ID: 100363

GID0482.jpg [ 24.64 KiB | Viewed 39805 times ]
Attachment:
GID0482.jpg [ 24.64 KiB | Viewed 39805 times ]
ShowHide Answer
Official Answer
Dropdown 1: 55
Dropdown 2: Z
Kudos
Bookmarks
For question A you can actually find the answer by approximation, to save some time.
The number of Y cars in 2006 is approximately 140. To reach 215 in 2010, the production increased by 75 cars. That's a little more than 50% of what was produced in 2006 (50% of 140 is 70) so the best answer must be B.
The number of Y cars in 2006 is approximately 140. To reach 215 in 2010, the production increased by 75 cars. That's a little more than 50% of what was produced in 2006 (50% of 140 is 70) so the best answer must be B.
Kudos
Bookmarks
AP6931
Attachment:
GID0482.jpg [ 46.54 KiB | Viewed 35369 times ]
Car assembled in 2006: 139,000
Car assembled in 2010: 215,000
Percent change
New - Old \(= 215,000-139,000=76,000\)
\(= \frac{76,000}{139,000} *100 = 54.67\)% \(= 55\)%
Answer: B


