Events & Promotions
|
|

GMAT Club Daily Prep
Thank you for using the timer - this advanced tool can estimate your performance and suggest more practice questions. We have subscribed you to Daily Prep Questions via email.
Customized
for You
Track
Your Progress
Practice
Pays
Not interested in getting valuable practice questions and articles delivered to your email? No problem, unsubscribe here.
- Nov 19
12:30 PM EST
-01:30 PM EST
Learn how Keshav, a Chartered Accountant, scored an impressive 705 on GMAT in just 30 days with GMATWhiz's expert guidance. In this video, he shares preparation tips and strategies that worked for him, including the mock, time management, and more - Nov 18
11:00 AM PST
-12:00 PM PST
Join us in a live GMAT practice session and solve 30 challenging GMAT questions with other test takers in timed conditions, covering GMAT Quant, Data Sufficiency, Data Insights, Reading Comprehension, and Critical Reasoning questions. - Nov 20
01:30 PM EST
-02:30 PM IST
Learn how Kamakshi achieved a GMAT 675 with an impressive 96th %ile in Data Insights. Discover the unique methods and exam strategies that helped her excel in DI along with other sections for a balanced and high score. - Nov 22
11:00 AM IST
-01:00 PM IST
Do RC/MSR passages scare you? e-GMAT is conducting a masterclass to help you learn – Learn effective reading strategies Tackle difficult RC & MSR with confidence Excel in timed test environment - Nov 23
11:00 AM IST
-01:00 PM IST
Attend this free GMAT Algebra Webinar and learn how to master the most challenging Inequalities and Absolute Value problems with ease. - Nov 24
07:00 PM PST
-08:00 PM PST
Full-length FE mock with insightful analytics, weakness diagnosis, and video explanations! - Nov 25
10:00 AM EST
-11:00 AM EST
Prefer video-based learning? The Target Test Prep OnDemand course is a one-of-a-kind video masterclass featuring 400 hours of lecture-style teaching by Scott Woodbury-Stewart, founder of Target Test Prep and one of the most accomplished GMAT instructors.
GMATCoachBen
 Expert
Tutor
Joined: 21 Mar 2017
Last visit: 18 Nov 2025
Posts: 465
Given Kudos: 210
Status:Professional GMAT Trainer
Affiliations: GMAT Coach
Location: United States (WA)
GMAT Focus 1: 775 Q87 V90 DI88 (Online) 

GMAT 1: 760 Q50 V44

GMAT 2: 770 Q51 V44

GMAT 3: 770 Q50 V44

GMAT 4: 770 Q50 V45 (Online)

GMAT 5: 780 Q51 V48

Expert reply
Kudos
Bookmarks
Dropdown 1: 5th
Dropdown 2: 10,000
Be sure to select an answer first to save it in the Error Log before revealing the correct answer (OA)!
Difficulty:
 75%
(hard)
Question Stats:
60% (02:33) correct 40%
(02:58)
wrong
  based on 3134
sessions
History
Date
Time
Result
Not Attempted Yet
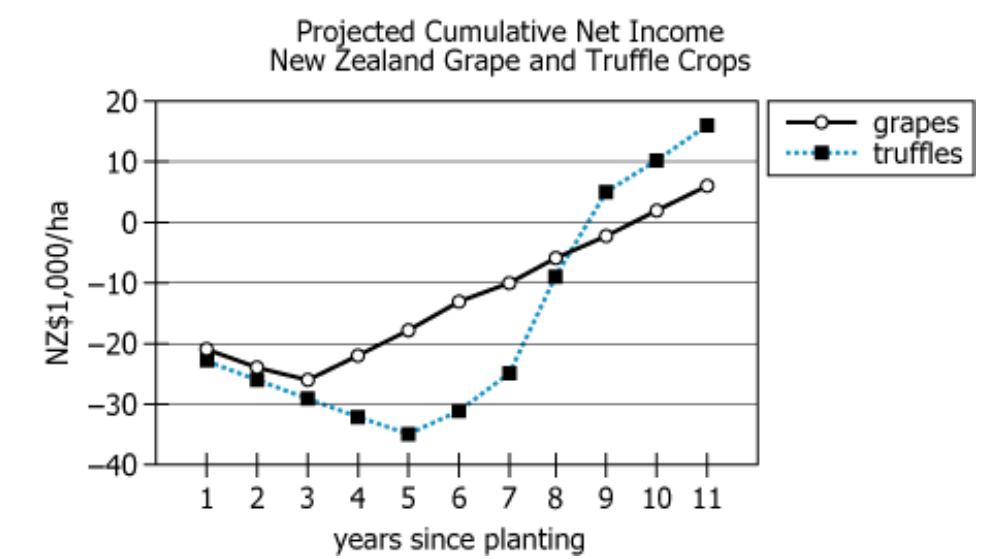
In New Zealand, the grape is a long-established crop, but the truffle—an edible fungus that grows on the roots of certain trees—became a commercial crop in the 1980s. The graph represents projected cumulative net income for grape and truffle crops through the end of the year, in thousands of New Zealand dollars per hectare (NZ$1,000/ha), for each of the first 11 years since planting. Cumulative net income is equal to total revenue from crop sales for the years since planting minus total investment costs over those same years.
From each drop-down menu, select the option that creates the most accurate statement about these projections based on the given information.
Cumulative net income from truffles is least at the end of the year since planting.
If cumulative net income for grapes continues to grow at the same rate as in years 8 through 11 since planting, the cumulative net income from grapes for the 12th year since planting will be approximately NZ$ per hectare.
ID: 100427

New Zealand Grape and Truffle Crops.png [ 103.37 KiB | Viewed 18160 times ]
Attachment:
New Zealand Grape and Truffle Crops.png [ 103.37 KiB | Viewed 18160 times ]
ShowHide Answer
Official Answer
Dropdown 1: 5th
Dropdown 2: 10,000
GMATCoachBen
 Expert
Tutor
Joined: 21 Mar 2017
Last visit: 18 Nov 2025
Posts: 465
Given Kudos: 210
Status:Professional GMAT Trainer
Affiliations: GMAT Coach
Location: United States (WA)
GMAT Focus 1: 775 Q87 V90 DI88 (Online) 

GMAT 1: 760 Q50 V44

GMAT 2: 770 Q51 V44

GMAT 3: 770 Q50 V44

GMAT 4: 770 Q50 V45 (Online)

GMAT 5: 780 Q51 V48

Expert reply
Kudos
Bookmarks
Video solution here:
I mentioned this other similar problem (Summer Olympics):
I mentioned this other similar problem (Summer Olympics):
Kudos
Bookmarks
GMATCoachBen
If I pick the values of this slope as 7 and -7
Then 14/3 = X-7 /1
X=35/3=11.66 seems closer to 13.
If I pick the values of this slope as 6 and -6
It’s 10.
But, from observation it seems more toward 7.
Is my method wrong or it is a close question?
If I pick the values of this slope as 7 and -7
Then 14/3 = X-7 /1
X=35/3=11.66 seems closer to 13.
If I pick the values of this slope as 6 and -6
It’s 10.
But, from observation it seems more toward 7.
Is my method wrong or it is a close question?


