Events & Promotions
|
|

GMAT Club Daily Prep
Thank you for using the timer - this advanced tool can estimate your performance and suggest more practice questions. We have subscribed you to Daily Prep Questions via email.
Customized
for You
Track
Your Progress
Practice
Pays
Not interested in getting valuable practice questions and articles delivered to your email? No problem, unsubscribe here.
 Jun 08
08:00 PM EDT
-10:00 PM EDT
Master the GMAT with expert live instruction, a personalized study plan, and real-time support. Includes 40 hours of online classes plus 6 months of access to the TTP GMAT OnDemand video course. Mon/Wed June 8, 2026 →August 12, 2026 8:00pm-10:00pm EST Jun 10
06:00 AM PDT
-06:15 PM PDT
Register for the GMAT Club Virtual MBA Spotlight Fair – the world’s premier event for serious MBA candidates. This is your chance to hear directly from Admissions Directors at nearly every Top 30 MBA program..- Jun 10
10:00 AM PDT
-11:00 AM PDT
Scoring 715 on the GMAT Focus Edition requires more than just learning formulas, memorizing concepts, or solving hundreds of questions. In this episode, Nishant shares how he improved his GMAT preparation by focusing on application of concepts, and more.  Jun 11
11:00 AM EDT
-01:00 PM EDT
TTP GMAT OnDemand gives serious students 400+ hours of expert video instruction, the full TTP course, AI support, weekly office hours, and a 715+ score guarantee—all built for elite GMAT score improvement.

Kudos
Bookmarks

Dropdown 1: 5 out of 6
Dropdown 2: 1 out of 3
Be sure to select an answer first to save it in the Error Log before revealing the correct answer (OA)!
Difficulty:
 65%
(hard)
65%
(hard)
Question Stats:
62% (02:31) correct 38%
(02:30)
wrong
based on 3133
sessions
38%
(02:30)
wrong
based on 3133
sessions
History
Date
Time
Result
Not Attempted Yet
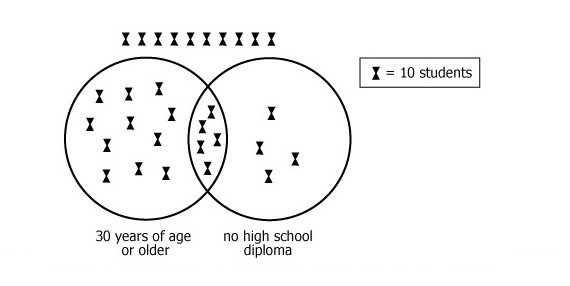
Refer to the pictograph of a survey of students at Central Community College. Each symbol represents 10 students in a sample of 300. Use the drop-down menus to complete each statement according to the information presented in the diagram.
1. If one student is selected at random from the 300 surveyed, the chance that the student will be under 30 or a high school graduate or both is
2. If one student is selected at random from the 300 surveyed, the chance that the student will be both under 30 and a high school graduate is
ShowHide Answer
Official Answer
Dropdown 1: 5 out of 6
Dropdown 2: 1 out of 3

Originally posted by BrentGMATPrepNow on 19 Apr 2020, 13:18.
Last edited by Bunuel on 12 Sep 2025, 02:50, edited 2 times in total.
Last edited by Bunuel on 12 Sep 2025, 02:50, edited 2 times in total.
Kudos
Bookmarks
Quote:
A student asked me to comment on question #1, so .....
The circle on the left holds all of the students who are 30 or over.
So all of the students who are UNDER 30 are OUTSIDE that circle.
So the students who are under 30 years of age are circled in red.

The circle on the right holds all of the students who did NOT graduate high school.
So all of the students who are OUTSIDE that circle are students who DID graduate.
So the students who graduated are circled in blue.

This means all of the students circled in green (below) represent students who are under 30, a high school graduate or both

There are 250 such people.
So, P(selected student is under 30, a high school graduate or both) = 250/300 = 5/6 = 5 out of 6
Answer: D
Cheers,
Brent


Kudos
Bookmarks
Question 2 : option B
Question 1 : Am getting 7/6 which I think is wrong.
350/300 is what am getting for Q1
Posted from my mobile device
Question 1 : Am getting 7/6 which I think is wrong.
350/300 is what am getting for Q1
Posted from my mobile device


