Events & Promotions
|
|

GMAT Club Daily Prep
Thank you for using the timer - this advanced tool can estimate your performance and suggest more practice questions. We have subscribed you to Daily Prep Questions via email.
Customized
for You
Track
Your Progress
Practice
Pays
Not interested in getting valuable practice questions and articles delivered to your email? No problem, unsubscribe here.
 May 21
10:00 AM EDT
-10:30 AM EDT
Most candidates submit a resume built for a recruiter. Admissions committees are reading for something else entirely. This session covers what adcoms actually evaluate, where strong candidates lose ground before a single essay is written, and why... May 22
08:30 AM PDT
-09:00 AM PDT
Get the inside scoop on what makes Emory’s Goizueta Business School great and how you can present a strong MBA application. Explore the difference between our One-Year MBA and Two-Year MBA programs, talk to our admissions team, and meet students. May 22
03:00 PM EDT
-04:00 PM EDT
The old MBA recruiting playbook is dead. Here’s how top admits are getting ahead this summer. May 23
08:00 PM PDT
-09:00 PM PDT
Inquire for a free profile evaluation and guarantee statement for possible admits and scholarships! May 29
10:00 AM PDT
-11:00 AM PDT
Download the MBA Launchpad App, for FREE access to the largest MBA database - Data backed read on your profile - Identify gaps before you apply - Build a balanced school list - Track your deadlines - Mock interviews - Extensive content library Jun 10
06:00 AM PDT
-06:15 PM PDT
Register for the GMAT Club Virtual MBA Spotlight Fair – the world’s premier event for serious MBA candidates. This is your chance to hear directly from Admissions Directors at nearly every Top 30 MBA program..

Regenerate
Originally posted by Regenerate on 25 Apr 2020, 02:22.
Last edited by Regenerate on 30 Apr 2020, 09:18, edited 1 time in total.
Last edited by Regenerate on 30 Apr 2020, 09:18, edited 1 time in total.
Kudos
Bookmarks
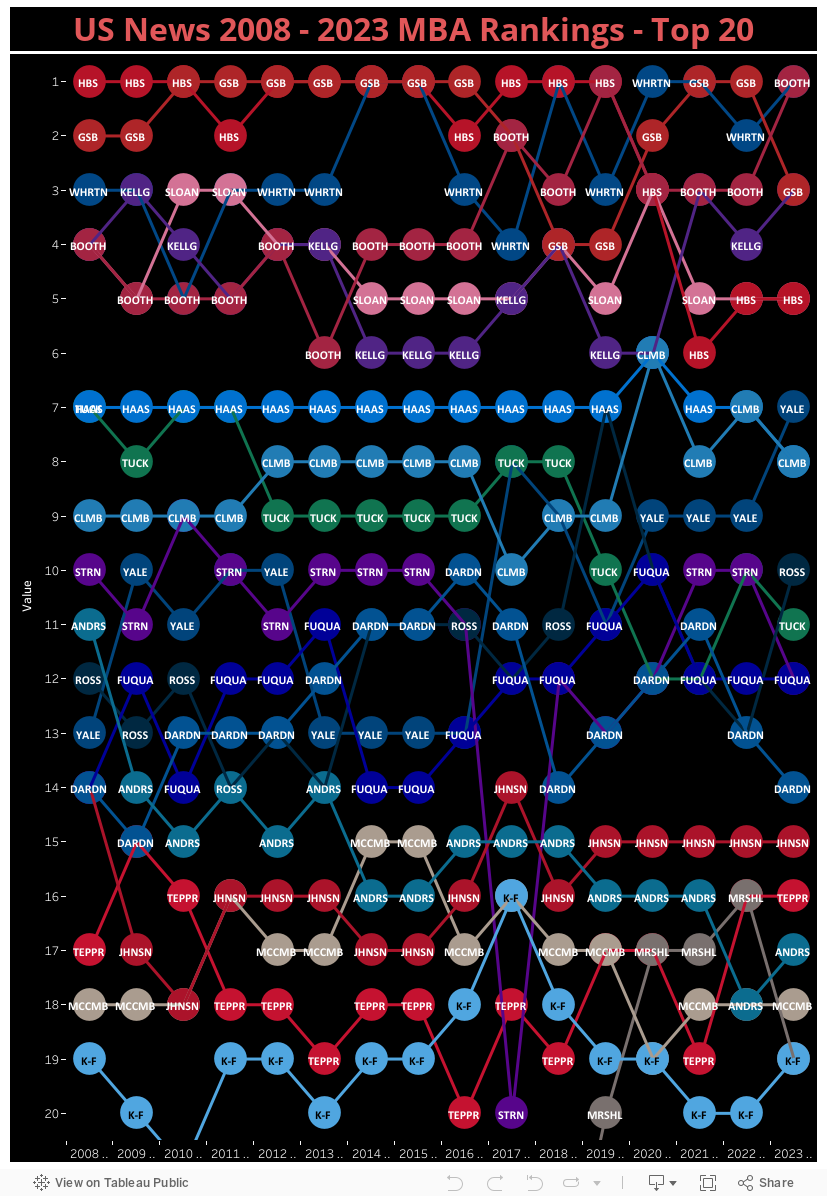
Tonight, I scraped the internet looking for legacy rankings for on-campus MBA rankings for US schools. Frankly, I was surprised I was able to find as much as I did ... as quickly as I did. The fine folks at USNWR don't make it easy, that's for sure!
As with any analysis of small data sets ... caveat emptor. The biggest assumption made is the volatility in the historic rankings of these schools over the past 20 years will generally reflect the volatility over the coming 20 years.
Results:
1) For each school with a ranking I could find (some years, I only had 20 schools, some 15, some 40+ and one year, only 10), I averaged the rankings given to that school.
2) This generated a bit of bias towards schools who were usually listed in the Top X schools, but weren't in the Top X in a year I only happened to find a few schools. For example, in 2006, Yale was not a top 15 program ... so, by eliminating their score (which was AT LEAST a 16, and maybe lower, it artificially increased their average score --- so --- to address this, and using Yale as an example, in all other years, Yale's average ranking was 11.5, but they weren't in the top 15 ... so ... I'd add 35% to their average (and round), which means that for 2006, Yale was ranked at 16 (11.5 x 135%, rounds to 16), and I'd keep doing this for schools (in decending order until I had at least 20 schools in a year). I also had to do this for the following schools in the following years (and the rankings given to each in those years):
2002 (top 10 only) -- Berkeley (11), Yale (16), NYU (16), Virginia (17), UCLA (18), Cornell (21), Texas (23), Carnegie Mellon (23), UNC (26), Emory (27), and USC (29)
2003 (top 16 only) -- Texas (23), Carnegie Mellon (23), UNC (26), Emory (27), and USC (29)
2006 (top 15 only) -- Yale (16), Carnegie Mellon (23), UNC (26), Emory (27), and USC (29)
2007 (top 26) -- USC (Marshall) wasn't in the top 26 that year, but is (otherwise) in the top 20 here ... so, I put in a 29 for it for this year
2008 -- Emory (Goizueta) got a 27 this year for the same reason USC (Marshall) got a 29 the prior year
2010 -- Emory (Goizueta) got a 27 and USC (Marshall) got 27 / 29, respectively
2011 -- UNC (Kenan-Flagler), USC (Marshall) and Emory (Goizueta) got 26, 27 and 29 ... same reasons ...
2012 -- Emory (Goizueta) got a 27 and USC (Marshall) got 27 / 29, respectively
..........................
Now, with the blanks filled in as reasonably as I was able given my constraints, the ranks were averaged, a slope was determined as was a standard deviation.
Once a school is at the top of a ranking, it's pretty hard for these schools to actually have a positive slope to their scores (i.e., the only place for them to go is down!) ... interestingly, the only schools in the top 10 for the last two decades with a positive slope was Chicago (Booth) at #6 and Duke (Fuqua) at #10. Other schools in the top 20 with positive slopes were Yale, NYU (Stern), UCLA (Anderson), Cornell (Johnson), Carnegie Mellon (Tepper), Texas (McCombs) and UNC (Kenan-Flagler).
..........................
This first list is in descending order of the school's average rank for the past 20 years -- but -- the #s next to each one reflect the most recent ten years / most distant ten years to give a rough idea for how the schools are moving up / down / sideways:
Harvard - 1.9 / 1.3 ... -0.6
Standord GSB - 1.8 / 1.6 ... -0.2
Penn (Wharton) - 2.3 / 3.2 ... +0.9 ... nearly as impressive as Chicago (Booth)'s increase, but not quite ...
MIT (Sloan) - 4.3 / 4.2 ... -0.1
Northwestern (Kellogg) - 4.9 / 4.1 ... -0.8
Chicago (Booth) - 3.5 / 6.2 ... +2.7 ... a very (!) impressive increase decade over decade, especially given they started off at such a great rank to begin with!
Berkeley (Haas) - 6.9 / 7.9 ... +1.0
Columbia - 8.3 / 7.4 ... -0.9
Dartmouth (Tuck) - 9.3 / 8.8 ... -0.5
Duke (Fuqua) - 11.9 / 10.2 ... -1.7 ... second biggest drop, decade over decade ...
Michigan (Ross) - 11.5 / 11.3 ... -0.2
Yale SOM - 10.5 / 13.4 ... +2.9 ... second biggest riser in the top 20
NYU (Stern) - 11.9 / 12.3 ... +0.4
Virginia (Darden) - 12.0 / 13.4 ... +1.4
UCLA (Anderson) - 15.2 / 13.1 ... -2.1 ... biggest drop decade over decade ...
Cornell (Johnson) - 15.8 / 16.2 ... +0.4
Carnegie Mellon (Tepper) - 18.3 / 18.4 ... +0.1
Texas (McCombs) - 16.9 / 19.9 ... +3.0 .. biggest mover in the top 20
UNC (Kenan-Flagler) - 19.4 / 21.7 ... +2.3
Emory (Goizueta) - 21.5 / 24.0 ... +2.5
.......................................
The rankings below are for the top 20 schools' ... and is based on their average over the past 20 years. The numbers in the parenthesis reflect 2 standard deviations on either side of the average, in an effort to give everyone a rough idea for where schools might reasonably be considered to be in twenty years' time (if past = prologue, that is). I didn't fiddle with anything in the list immediately below to reflect the positive / negative slopes. The "two decade top 20" is:
Harvard -- 1.6 (range of 1.0 to 4.0) ... note: for schools at the very top, reducing their average score two standard deviations from their average would actually give them a 'negative rank', and since that's not possible, I made it 1.0
Stanford GSB -- 1.7 (range of 1.0 to 3.5) ... meaning, Stanford had less deviation in their year to year rankings than Harvard, hence their better 'worst case' ranking of 3.5 vs. 4.0
Penn (Wharton) -- 2.8 (range of 1.0 to 4.8)
MIT (Sloan) -- 4.3 (range of 2.9 to 5.7) ... smallest standard deviation of the top programs
Northwestern (Kellogg) -- 4.5 (range of 2.5 to 6.5)
Chicago (Booth) -- 4.9 (range of 1.0 to 8.9) ... biggest standard deviation of the top programs ... and when combined with their positive slope, would give the the best argument of schools in this group to turn the top three into the top four ...
Berkeley (Haas) -- 7.4 (range of 5.2 to 9.6)
Columbia -- 7.9 (range 5.5 to 10.3)
Dartmouth (Tuck) -- 9.1 (range 6.3 to 11.9)
Duke (Fuqua) -- 11.1 (range 6.8 to 15.5) ... best case nearly matches Dartmouth, but lower starting average and bigger volatility in ranking keeps them from being in the same tier
Michigan (Ross) -- 11.4 (range 8.2 to 14.6) ... a lower risk school (if rankings is all that matters) than Duke, Yale, NYU and Virginia ...
Yale SOM -- 12.0 (range 7.2 to 16.8)
NYU (Stern) -- 12.1 (range 7.3 to 16.9)
Virginia (Darden) -- 12.7 (range 9.1 to 16.3)
UCLA (Anderson) -- 14.2 (range 10.0 to 18.4)
Cornell (Johnson) -- 16.0 (range 13.0 to 19.0)
Carnegie Mellon (Tepper) -- 18.4 (range 13.8 to 23.0)
Texas (McCombs) -- 18.4 (range 13.4 to 23.4)
UNC (Kenan-Flagler) -- 20.6 (range 14.8 to 26.4)
Emory (Goizueta) -- 22.8 (range 16.0 to 29.2)
.....................
This means that a reasonable argument could be made that Texas (McCombs), UNC (Kenan-Flagler) and Emory (Goizueta) are the most likely to find themselves OUTSIDE the top 25 at some point.
It also means that while Chicago (Booth), Berkeley (Haas), Columbia, Dartmouth (Tuck) and Duke (Fuqua) are all ahead of Michigan (Ross) today, there does exist a possibility Michigan (Ross) could find themselves ranked in front of all of those schools at some point in the next two decades.
+++++++++++++++++++++++
This list makes an effort to do two things -- tier the schools based on averages AND slopes ... schools in a tier are listed alphabetically:
Tier 1 ... have a hard time seeing any of these ever being out of the top five
Harvard, Penn (Wharton) and Stanford
Tier 2 ... have a hard time seeing any of these ever being out of the top ten
Chicago (Booth), MIT and Northwestern (Kellog)
Tier 3 ... have a hard time seeing any of these ever GET INTO the top five
Berkeley (Haas) and Columbia
Tier 4 ... have a hard time seeing this one too far on either side of 10th for very long
Dartmouth (Tuck)
Tier 5 ... have an easy time seeing these crack the top 10 from time to time and rarely, if ever, getting out of the top 15 as a worst case scenario
Duke (Fuqua), Michigan (Ross), NYU (Stern), Virginia (Darden) and Yale SOM
Tier 6 ... might crack the top 15 from time to time, but are pretty comfortably in the top 20 as a worst case scenario
Cornell (Johnson) and UCLA (Anderson)
Tier 7 ... while it'd be really tough, one or two might crack the top 15, but each one of them has a chance to fall out of the top 25
Carnegie Mellon (Tepper), Emory (Goizueta), Texas (McCombs) and UNC (Kenan-Flagler)
{}{}{}{}{}{}{}{}{}{}
SUMMARY: If where your school is ranked is important to you, uber alles, you might want to take this into consideration when deciding whether or not it's worth it to save a couple of bucks to attend one school ... or to reapply next year ... or ... or ... or ... etc ...
Good luck to everyone!

Kudos
Bookmarks
This is some really great analysis and I like your conclusions and agree with them. I think the only addition I would say is that it's hard for me to see Booth out of the top five.
Posted from my mobile device
Posted from my mobile device
Regenerate
Kudos
Bookmarks
MBAPrepCoach
Because of trend, absolutely.
Because of prior positioning, I think they're good where they are.
In five years' time, a different answer could very easily be reached (especially if HBS doesn't bounce back).