Events & Promotions
|
|

GMAT Club Daily Prep
Thank you for using the timer - this advanced tool can estimate your performance and suggest more practice questions. We have subscribed you to Daily Prep Questions via email.
Customized
for You
Track
Your Progress
Practice
Pays
Not interested in getting valuable practice questions and articles delivered to your email? No problem, unsubscribe here.
- Nov 20
07:30 AM PST
-08:30 AM PST
Learn what truly sets the UC Riverside MBA apart and how it helps in your professional growth
Originally posted by Sajjad1994 on 03 Aug 2020, 22:19.
Last edited by Bunuel on 05 Oct 2025, 07:33, edited 3 times in total.
Last edited by Bunuel on 05 Oct 2025, 07:33, edited 3 times in total.
Moved to new forum
Kudos
Bookmarks
Dropdown 1: More
Dropdown 2: Higher
Be sure to select an answer first to save it in the Error Log before revealing the correct answer (OA)!
Difficulty:
 75%
(hard)
Question Stats:
63% (02:21) correct 37%
(02:16)
wrong
  based on 789
sessions
History
Date
Time
Result
Not Attempted Yet
Veritas Prep

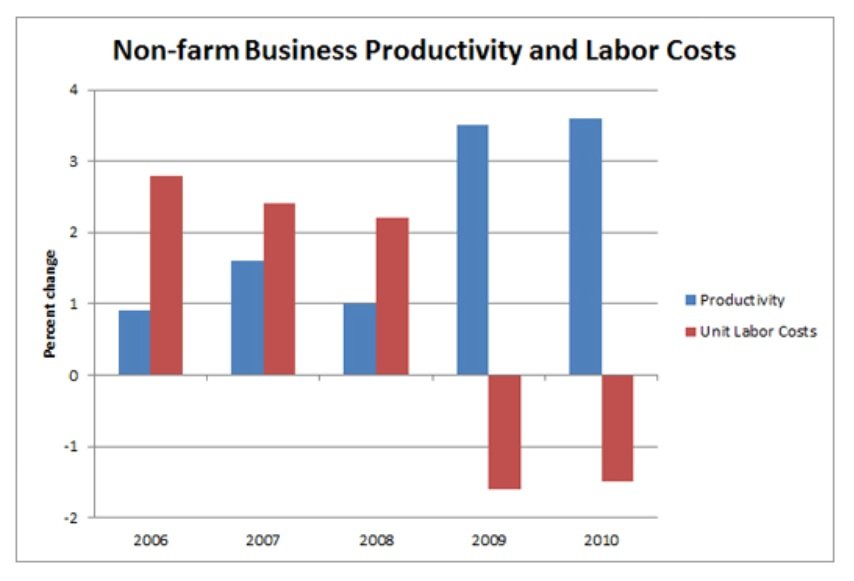
The attached graph shows the year-over-year percent change in productivity and unit labor cost as measured by the Bureau of Labor Statistics across five years. Using the graph, please answer the questions that follow.
A. On average businesses were productive in 2008 than they were in 2007?
A. More
B. Less
C. As
B. On average, unit labor costs were in 2010 than they were in 2005.
A. Higher
B. Lower
C. Productivity increased for ______________ of the years graphed.
A. 3
B. 4
C. 5

12WQ.jpg [ 60.63 KiB | Viewed 8911 times ]
The attached graph shows the year-over-year percent change in productivity and unit labor cost as measured by the Bureau of Labor Statistics across five years. Using the graph, please answer the questions that follow.
A. On average businesses were productive in 2008 than they were in 2007?
A. More
B. Less
C. As
B. On average, unit labor costs were in 2010 than they were in 2005.
A. Higher
B. Lower
C. Productivity increased for ______________ of the years graphed.
A. 3
B. 4
C. 5
A, A and C
Attachment:
12WQ.jpg [ 60.63 KiB | Viewed 8911 times ]
ShowHide Answer
Official Answer
Dropdown 1: More
Dropdown 2: Higher
yashikaaggarwal

Senior Moderator - Masters Forum
Joined: 19 Jan 2020
Last visit: 17 Jul 2025
Posts: 3,086
Given Kudos: 1,510
Location: India
Schools: Cranfield (A) Warwick MiM "23 (M)
GPA: 4
WE:Analyst (Internet and New Media)
Kudos
Bookmarks
Let the productivity before 2006 be X
And unit labour cost be Y
In 2006:
Productivity: X*100.9/100 = 1.009X
Unit labour cost: Y*102.75/100 = 1.0275Y
In 2007:
Productivity: 1.009X*101.6/100 = 1.025X
Unit labour cost: 1.0275Y*102.5/100 = 1.05Y
In 2008:
Productivity: 1.025X*101/100 = 1.036X
Unit labour cost: 1.05Y*102.25/100 = 1.08Y
In 2009:
Productivity: 1.036X*103.5/100 = 1.07X
Unit labour cost: 1.08Y*98.5/100 = 1.06Y
In 2010:
Productivity: 1.07X*103.6/100 = 1.1X
Unit labour cost: 1.06Y*98.6/100 = 1.05Y
A. On average businesses were ____MORE____ productive in 2008 than they were in 2007?
=> 2007 Productivity = 1.025X
=> 2008 Productivity = 1.036X (More)
B. On average, unit labor costs were ______HIGHER______ in 2010 than they were in 2005.
=> Unit Labour Cost in 2010 = 1.05Y {Higher}
=> Unit Labour Cost in 2005 = Y
C. Productivity increased for ______5______ of the years graphed.
=> Productivity has increased in all 5 years irrespective of any change percentage.
A. More
B. Higher
C. 5
Posted from my mobile device
DiyaSouravi99
Kudos
Bookmarks
@bunnel karishma


