Events & Promotions
|
|

GMAT Club Daily Prep
Thank you for using the timer - this advanced tool can estimate your performance and suggest more practice questions. We have subscribed you to Daily Prep Questions via email.
Customized
for You
Track
Your Progress
Practice
Pays
Not interested in getting valuable practice questions and articles delivered to your email? No problem, unsubscribe here.
 May 25
12:01 AM PDT
-11:59 PM PDT
On the 25th, GMAT Club Tests will be Free! Including all the Quizzes, Questions, and Tests. 12 AM - 11:59 PM PST May 21
10:00 AM EDT
-11:59 PM EDT
Make the most of your break with the most realistic GMAT™ prep. Take up to $700 off select products. May 22
11:00 AM EDT
-11:59 PM EDT
Take 30% off all study plans with code PICNIC - Expires on Monday, May 25th- Jun 10
06:00 AM PDT
-06:15 PM PDT
Register for the GMAT Club Virtual MBA Spotlight Fair – the world’s premier event for serious MBA candidates. This is your chance to hear directly from Admissions Directors at nearly every Top 30 MBA program..


Kudos
Bookmarks

Dropdown 1: GDP real growth rate
Dropdown 2: $600 million
Be sure to select an answer first to save it in the Error Log before revealing the correct answer (OA)!
Difficulty:
 25%
(medium)
25%
(medium)
Question Stats:
84% (01:24) correct 16%
(01:34)
wrong
based on 248
sessions
16%
(01:34)
wrong
based on 248
sessions
History
Date
Time
Result
Not Attempted Yet
The chart provided displays the Gross Domestic Product (GDP), GDP real growth rate, Infant mortality rate, Life expectancy rate, Population, Area, Population density, and population growth rate of the three countries, namely the USA, Russia, and China.
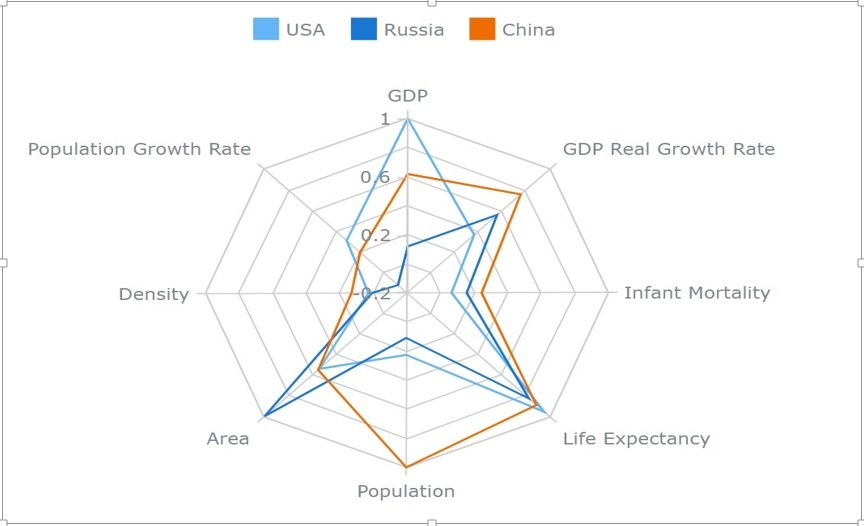
Choose the most appropriate option from the dropdown menu below based on the information provided.
I. China is the leader in terms of
II. If the GDP of USA is $1 billion, then the GDP of China is

12.jpg [ 64.76 KiB | Viewed 4436 times ]
Choose the most appropriate option from the dropdown menu below based on the information provided.
I. China is the leader in terms of
II. If the GDP of USA is $1 billion, then the GDP of China is
Attachment:
12.jpg [ 64.76 KiB | Viewed 4436 times ]
ShowHide Answer
Official Answer
Dropdown 1: GDP real growth rate
Dropdown 2: $600 million

Kudos
Bookmarks
Sajjad1994
For I, observe the orange colored line in each of the eight categories. China leads in GDP Real Growth Rate, Infant Mortality, Population, and Density. Among these, GDP Real Growth Rate is present in the drop-down and hence our answer
For II, given that the GDP of USA is $1B. In the GDP category of the graph, $1B is equivalent to 1. Similarly China has 0.6 in that category. This implies China's GDP is 60% that of USA. So our answer is $600M.
+1 Kudos if it helped


Kudos
Bookmarks
Sajjad1994
It's a spider chart in which various straight lines are showing the variables measured to establish comparison of three countries
I. China is the leader in terms of
- GDP: on this dimension the leader is light blue line representing USA hence INCORRECT ANSWER
- AREA: on this dimension the leader is Dark blue line representing RUSSIA hence INCORRECT ANSWER
- Population Growth rate: on this dimension the leader is light blue line representing USA hence INCORRECT ANSWER
- GDP Real Growth Rate: on this dimension the leader is Orange line representing CHINA hence CORRECT ANSWER
II. If the GDP of USA is $1 billion, then the GDP of China is
Looking at graph we see that if USA GDP is $1 billion then china's GDP should be 0.6 billion
1 billion = 1000 million
i.e. 0.6 billion = 600 million


