Events & Promotions
|
|

GMAT Club Daily Prep
Thank you for using the timer - this advanced tool can estimate your performance and suggest more practice questions. We have subscribed you to Daily Prep Questions via email.
Customized
for You
Track
Your Progress
Practice
Pays
Not interested in getting valuable practice questions and articles delivered to your email? No problem, unsubscribe here.
 May 21
10:00 AM EDT
-11:59 PM EDT
Make the most of your break with the most realistic GMAT™ prep. Take up to $700 off select products. May 22
08:30 AM PDT
-09:30 AM PDT
For many Indian MBA applicants, the default dream has long been a top US MBA. But as career goals, visa considerations, timelines, and global mobility priorities evolve, more candidates are seriously considering MBA programs in Europe. May 22
11:00 AM EDT
-11:59 PM EDT
Take 30% off all study plans with code PICNIC - Expires on Monday, May 25th- Jun 10
06:00 AM PDT
-06:15 PM PDT
Register for the GMAT Club Virtual MBA Spotlight Fair – the world’s premier event for serious MBA candidates. This is your chance to hear directly from Admissions Directors at nearly every Top 30 MBA program..


Kudos
Bookmarks

Dropdown 1: 9
Dropdown 2: June
Be sure to select an answer first to save it in the Error Log before revealing the correct answer (OA)!
Difficulty:
 35%
(medium)
35%
(medium)
Question Stats:
74% (02:09) correct 26%
(02:06)
wrong
based on 411
sessions
26%
(02:06)
wrong
based on 411
sessions
History
Date
Time
Result
Not Attempted Yet
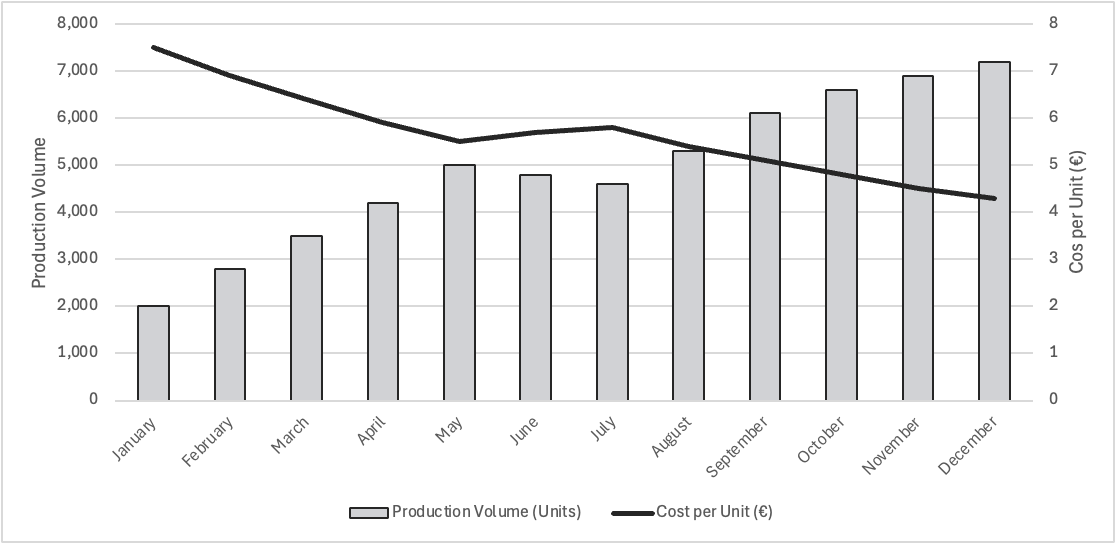
The graph above displays data from a manufacturer’s operations over a 12-month period.
The bar chart shows the total production volume (in units) for each month (measured on the left vertical axis), while the line graph shows the corresponding cost per unit (in euros, measured on the right vertical axis).
An operations analyst defines:
Based on the information in the graph:
The number of month-to-month intervals during which the company demonstrates economies of scale is and the first month in which the company demonstrates an inefficiency event is

GMAT-Club-Forum-pu8acq4f.png [ 40.08 KiB | Viewed 2468 times ]
The bar chart shows the total production volume (in units) for each month (measured on the left vertical axis), while the line graph shows the corresponding cost per unit (in euros, measured on the right vertical axis).
An operations analyst defines:
- Economies of scale as any month-to-month period during which production increases while cost per unit decreases. For eg. if production increases from March to April, and correspondingly, cost per unit decreases, that counts as 1 month-to-month period.
- An inefficiency event as any month-to-month period during which production decreases while cost per unit increases.
Based on the information in the graph:
The number of month-to-month intervals during which the company demonstrates economies of scale is and the first month in which the company demonstrates an inefficiency event is
Attachment:
GMAT-Club-Forum-pu8acq4f.png [ 40.08 KiB | Viewed 2468 times ]
ShowHide Answer
Official Answer
Dropdown 1: 9
Dropdown 2: June

Kudos
Bookmarks
The analysis of the Operation Analyst pretty much forms our base for answering the question.
1. There are total 9 Economies of Scale ( Increase in prod whilst a simultaneous decrease in the cost per unit ) namely: Jan-Feb, Feb-Mar, Mar-Apr, Apr-May, Jul-Aug, Aug-Sept, Sept-Oct, Oct-Nov & Nov-Dec. Thus 9 intervals.
2. An inefficiency event (Decrease in Prod and Increase in per unit cost) can be easily observed for months of June & July.
Kudos
Bookmarks
Bunuel
Solution:
Dropdown 1: Number of month-to-month intervals showing economies of scale
An economy of scale occurs when, from one month to the next, production increases and cost per unit decreases.
Visually inspecting the graph, we observe the following intervals meet this condition:
January → February: Bar increases, line decreases
February → March: Bar increases, line decreases
March → April: Bar increases, line decreases
April → May: Bar increases, line decreases
July → August: Bar increases, line decreases
August → September: Bar increases, line decreases
September → October: Bar increases, line decreases
October → November: Bar increases, line decreases
November → December: Bar increases, line decreases
This gives a total of 9 intervals.
Correct answer: 9
Dropdown 2: First month with a production decrease and cost increase
An inefficiency event is defined as a month where production decreases while cost per unit increases.
This pattern first occurs between:
May → June:
Bar decreases slightly → production falls
Line rises → cost per unit increases
This is the first month-to-month period in which both conditions for an inefficiency are satisfied.
Correct answer: June