Events & Promotions
|
|

GMAT Club Daily Prep
Thank you for using the timer - this advanced tool can estimate your performance and suggest more practice questions. We have subscribed you to Daily Prep Questions via email.
Customized
for You
Track
Your Progress
Practice
Pays
Not interested in getting valuable practice questions and articles delivered to your email? No problem, unsubscribe here.
- Nov 19
12:30 PM EST
-01:30 PM EST
Learn how Keshav, a Chartered Accountant, scored an impressive 705 on GMAT in just 30 days with GMATWhiz's expert guidance. In this video, he shares preparation tips and strategies that worked for him, including the mock, time management, and more - Nov 20
07:30 AM PST
-08:30 AM PST
Learn what truly sets the UC Riverside MBA apart and how it helps in your professional growth - Nov 20
01:30 PM EST
-02:30 PM IST
Learn how Kamakshi achieved a GMAT 675 with an impressive 96th %ile in Data Insights. Discover the unique methods and exam strategies that helped her excel in DI along with other sections for a balanced and high score. - Nov 22
11:00 AM IST
-01:00 PM IST
Do RC/MSR passages scare you? e-GMAT is conducting a masterclass to help you learn – Learn effective reading strategies Tackle difficult RC & MSR with confidence Excel in timed test environment - Nov 23
11:00 AM IST
-01:00 PM IST
Attend this free GMAT Algebra Webinar and learn how to master the most challenging Inequalities and Absolute Value problems with ease. - Nov 24
07:00 PM PST
-08:00 PM PST
Full-length FE mock with insightful analytics, weakness diagnosis, and video explanations! - Nov 25
10:00 AM EST
-11:00 AM EST
Prefer video-based learning? The Target Test Prep OnDemand course is a one-of-a-kind video masterclass featuring 400 hours of lecture-style teaching by Scott Woodbury-Stewart, founder of Target Test Prep and one of the most accomplished GMAT instructors.
Kudos
Bookmarks
Dropdown 1: negatively correlated
Dropdown 2: 8
Be sure to select an answer first to save it in the Error Log before revealing the correct answer (OA)!
Difficulty:
 55%
(hard)
Question Stats:
54% (01:11) correct 46%
(01:12)
wrong
  based on 1200
sessions
History
Date
Time
Result
Not Attempted Yet

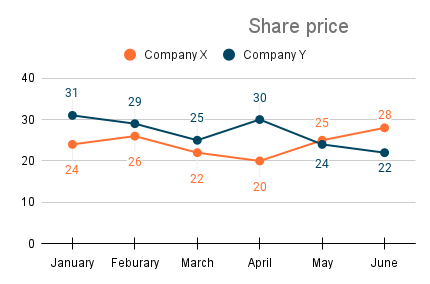
The graph above shows the share prices of Company X and Company Y over the first six months of 2021, based on the last working day of each month.
Select from each drop-down menu the option that creates the most accurate statement, given the information provided.
Based on the graph above, the share prices of the companies are .
The range of the share price of Company X on the last working day for the six months shown in the graph is .

GMAT-Club-Forum-c0j2jgl1.png [ 14.38 KiB | Viewed 2519 times ]
The graph above shows the share prices of Company X and Company Y over the first six months of 2021, based on the last working day of each month.
Select from each drop-down menu the option that creates the most accurate statement, given the information provided.
Based on the graph above, the share prices of the companies are .
The range of the share price of Company X on the last working day for the six months shown in the graph is .
Attachment:
GMAT-Club-Forum-c0j2jgl1.png [ 14.38 KiB | Viewed 2519 times ]
ShowHide Answer
Official Answer
Dropdown 1: negatively correlated
Dropdown 2: 8
Kudos
Bookmarks
Bunuel
Official Solution:
Drop-down 1:
Two data sets are positively correlated if they both tend to be higher in the same cases. They are negatively correlated if one tends to be higher in cases where the other is lower. For positively correlated data, their lines tend to slope up or down together; the more consistently this happens, the stronger the positive correlation. Conversely, when two data sets are negatively correlated, the line for one tends to slope up while the other slopes down, and vice versa. The more consistently these opposite slopes occur, the stronger the negative correlation.
Examining the graph, we observe that the lines for the shares of Company X and Y slope in opposite directions in 4 out of 5 cases. Thus, we can conclude that the share prices are negatively correlated.
Drop-down 2:
The range is the difference between the highest value and the lowest value. The highest price for Company X's share was in June at 28, and the lowest price was in April at 20, making the range equal to 28 - 20 = 8.
Correct answer:
Dropdown 1: "negatively correlated"
Dropdown 2: "8"
Attachment:
GMAT-Club-Forum-5v6aho52.png [ 14.38 KiB | Viewed 2481 times ]
Kudos
Bookmarks
1. Positive correlation (+) is when intervals from both companies X and Y increase/decrease together. Negative correlation (-) is when one increases and the other decreases.
2. Let's consider each interval of the graph:
- January/February: -
- February/March: +
- March/April: -
- April/May: -
- May/June: -
As we can see, the two graphs are mainly negatively correlated.
3. Company X is the orange graph. It's range is equal to the absolute difference between the lowest (20) and highest (28), which is 28 - 20 = 8.
4. Our answer will be: "negatively correlated" and 8.


