Events & Promotions
|
|

GMAT Club Daily Prep
Thank you for using the timer - this advanced tool can estimate your performance and suggest more practice questions. We have subscribed you to Daily Prep Questions via email.
Customized
for You
Track
Your Progress
Practice
Pays
Not interested in getting valuable practice questions and articles delivered to your email? No problem, unsubscribe here.
- Nov 20
07:30 AM PST
-08:30 AM PST
Learn what truly sets the UC Riverside MBA apart and how it helps in your professional growth - Nov 22
11:00 AM IST
-01:00 PM IST
Do RC/MSR passages scare you? e-GMAT is conducting a masterclass to help you learn – Learn effective reading strategies Tackle difficult RC & MSR with confidence Excel in timed test environment - Nov 23
11:00 AM IST
-01:00 PM IST
Attend this free GMAT Algebra Webinar and learn how to master the most challenging Inequalities and Absolute Value problems with ease. - Nov 25
10:00 AM EST
-11:00 AM EST
Prefer video-based learning? The Target Test Prep OnDemand course is a one-of-a-kind video masterclass featuring 400 hours of lecture-style teaching by Scott Woodbury-Stewart, founder of Target Test Prep and one of the most accomplished GMAT instructors.
Dropdown 1: London
Dropdown 2: 20%
Be sure to select an answer first to save it in the Error Log before revealing the correct answer (OA)!
Difficulty:
 45%
(medium)
Question Stats:
57% (01:45) correct 43%
(02:06)
wrong
  based on 3488
sessions
History
Date
Time
Result
Not Attempted Yet
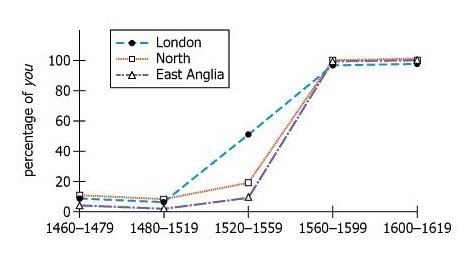
The graph indicates the results of a survey of written material from three areas in early modern England. The graph shows the percent of use of you when either you or ye would be appropriate. Select the option from each drop-down menu that creates the statement that most accurately reflects the information provided.
The area of early modern England that was first to favor the use of you over ye was .
In the surveyed writings from the area of the North between 1520 and 1559, you constituted of the instances in which either you or ye would have been appropriate.
ID: 100356

2016-08-21_11-11-43.jpg [ 137.29 KiB | Viewed 34285 times ]

2016-08-21_11-11-43.jpg [ 28.95 KiB | Viewed 22395 times ]
Attachment:
2016-08-21_11-11-43.jpg [ 137.29 KiB | Viewed 34285 times ]
Attachment:
2016-08-21_11-11-43.jpg [ 28.95 KiB | Viewed 22395 times ]
ShowHide Answer
Official Answer
Dropdown 1: London
Dropdown 2: 20%
Kudos
Bookmarks
London and 20%:
1) You are looking for the first area in which the use of the word "you" exceeds 50% (as that would mean you > ye)
2) X coordinate of the North Graph given by "1520 to 1559", corresponding y coordinate is 20%
1) You are looking for the first area in which the use of the word "you" exceeds 50% (as that would mean you > ye)
2) X coordinate of the North Graph given by "1520 to 1559", corresponding y coordinate is 20%
Kudos
Bookmarks
For 1st,
Shouldn't be north as north curve is above London curve at start of curve?
Please explain. how you deduced London over North.
Shouldn't be north as north curve is above London curve at start of curve?
Please explain. how you deduced London over North.


