Events & Promotions
|
|

GMAT Club Daily Prep
Thank you for using the timer - this advanced tool can estimate your performance and suggest more practice questions. We have subscribed you to Daily Prep Questions via email.
Customized
for You
Track
Your Progress
Practice
Pays
Not interested in getting valuable practice questions and articles delivered to your email? No problem, unsubscribe here.
 May 18
10:00 AM PDT
-11:00 AM PDT
Join us in a live GMAT practice session and solve 25 challenging GMAT questions with other test takers in timed conditions, covering GMAT Quant, Data Sufficiency, Data Insights, Reading Comprehension, and Critical Reasoning questions. May 12
12:00 PM EDT
-11:59 PM EDT
Make the most of your break with the most realistic GMAT™ prep. Take up to $700 off select products. Ends 6/1 May 15
01:00 PM IST
-11:00 AM IST
Start your journey with a fully customized action plan and work with a dedicated mentor to achieve a 735+ score.- May 19
12:00 PM PDT
-01:00 PM PDT
Scoring 329 on the GRE is not always about using more books, more courses, or a longer study plan. In this episode of GRE Success Talks, Ashutosh shares his GRE preparation strategy, study plan, and test-day experience, explaining how he kept his prep.... - Jun 10
06:00 AM PDT
-06:15 PM PDT
Register for the GMAT Club Virtual MBA Spotlight Fair – the world’s premier event for serious MBA candidates. This is your chance to hear directly from Admissions Directors at nearly every Top 30 MBA program..


Dropdown 1: 1960-1990
Dropdown 2: 136 million
Be sure to select an answer first to save it in the Error Log before revealing the correct answer (OA)!
Difficulty:
 95%
(hard)
95%
(hard)
Question Stats:
18% (03:24) correct 82%
(03:26)
wrong
based on 446
sessions
82%
(03:26)
wrong
based on 446
sessions
History
Date
Time
Result
Not Attempted Yet
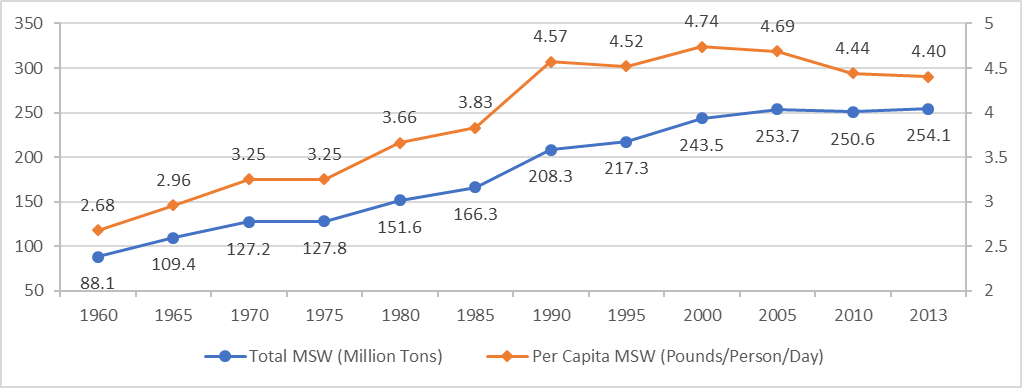
The graph shows the total municipal solid waste (MSW) generated in the United States from 1960 to 2013 (blue line) and the per capita MSW per day (orange line). Total MSW is measured in million tons, while per capita MSW per day is measured in pounds (1 ton = 2,000 pounds).
Select the most accurate option from each drop-down menu to complete the statements based on the information provided.
The greatest percentage change in total solid waste generation for any 30-year period during the study was between .
The municipal population of the United States increased by approximately people from 1960 to 2013.
Attachment:
12.jpg [ 71.97 KiB | Viewed 7959 times ]
ShowHide Answer
Official Answer
Dropdown 1: 1960-1990
Dropdown 2: 136 million
Kudos
Bookmarks
Bunuel
Official Solution:
Drop-down 1:
By examining the graph, we can estimate that the greatest percentage change, represented by the steepest increase, occurred between 1960 and 1990. During this period, total solid waste generation increased from approximately 90 to 210, an increase of about 2.3 times. For other listed 30-year periods, the increase was less than twofold.
Drop-down 2:
The total MSW generated in 1960 was approximately 90 million tons, or 180,000 million pounds (since 1 ton = 2,000 pounds). Per capita waste per year was 2.68 * 365 ≈ 1,000 pounds. Thus, the municipal population in 1960 was (180,000 million pounds) / (1,000 pounds) ≈ 180 million people.
The total MSW generated in 2013 was approximately 250 million tons, or 500,000 million pounds (since 1 ton = 2,000 pounds). Per capita waste per year was 4.40 * 365 ≈ 1,600 pounds. Thus, the municipal population in 2013 was (500,000 million pounds) / (1,600 pounds) ≈ 310 million people.
Therefore, the municipal population of the United States increased by approximately 310 - 180 = 130 million people.
Correct answer:
Dropdown 1: "1960-1990"
Dropdown 2: "135 million"

Kudos
Bookmarks
1. The graph for total MSW generated per year starts out linearly increasing but later stops increasing. So, intuitively the greatest percent change is from 1960 to 1990. We can also check for every answer choice:
- 1960-1990: \(\frac{208.3 - 88.1}{88.1} * 100\% = 136.44\%\).
- 1965-1995: \(\frac{217.3 - 109.4}{109.4} * 100\% = 98.63\%\).
- 1970-2000: \(\frac{243.5 - 127.2}{127.2} * 100\% = 91.43\%\).
- 1975-2005: \(\frac{253.7 - 127.8}{127.8} * 100\% = 98.51\%\).
- 1980-2010: \(\frac{250.6 - 151.6}{151.6} * 100\% = 65.30\%\).
2. Let's write out a formula to figure out the municipal population of a given year using the total and per capita MSW values. \(Per \ capita \ MSW = \frac{\frac{Total \ MSW * 2000 * 1000000}{Municipal \ population}}{Days \ in \ a \ year} = \frac{Total \ MSW * 2000 * 1000000}{Municipal \ population * 365.25}\). Then, \(Municipal \ population = \frac{Total \ MSW * 2000 * 1000000}{Per \ capita \ MSW * 365.25}\). For 2013 and 1960 the municipal population was about \(\frac{88.1 * 2000 * 1000000}{2.68 * 365.25} = 180003473.4 \approx 180\) million and \(\frac{254.1 * 2000 * 1000000}{4.40 * 365.25} = 316221765.9 \approx 316.22\) million, respectively. The difference will be \(316.22 - 180 = 136.22\) million, which is closest to the answer choice 136 million.
3. Our answer will be: 1960-1990 and 136 million.


