Events & Promotions
|
|

GMAT Club Daily Prep
Thank you for using the timer - this advanced tool can estimate your performance and suggest more practice questions. We have subscribed you to Daily Prep Questions via email.
Customized
for You
Track
Your Progress
Practice
Pays
Not interested in getting valuable practice questions and articles delivered to your email? No problem, unsubscribe here.
- Nov 18
11:00 AM PST
-12:00 PM PST
Join us in a live GMAT practice session and solve 30 challenging GMAT questions with other test takers in timed conditions, covering GMAT Quant, Data Sufficiency, Data Insights, Reading Comprehension, and Critical Reasoning questions. - Nov 22
11:00 AM IST
-01:00 PM IST
Do RC/MSR passages scare you? e-GMAT is conducting a masterclass to help you learn – Learn effective reading strategies Tackle difficult RC & MSR with confidence Excel in timed test environment - Nov 23
11:00 AM IST
-01:00 PM IST
Attend this free GMAT Algebra Webinar and learn how to master the most challenging Inequalities and Absolute Value problems with ease. - Nov 25
10:00 AM EST
-11:00 AM EST
Prefer video-based learning? The Target Test Prep OnDemand course is a one-of-a-kind video masterclass featuring 400 hours of lecture-style teaching by Scott Woodbury-Stewart, founder of Target Test Prep and one of the most accomplished GMAT instructors.
Kudos
Bookmarks
Dropdown 1: 8%
Dropdown 2: $1879
Be sure to select an answer first to save it in the Error Log before revealing the correct answer (OA)!
Difficulty:
 95%
(hard)
Question Stats:
53% (03:58) correct 47%
(03:54)
wrong
  based on 187
sessions
History
Date
Time
Result
Not Attempted Yet
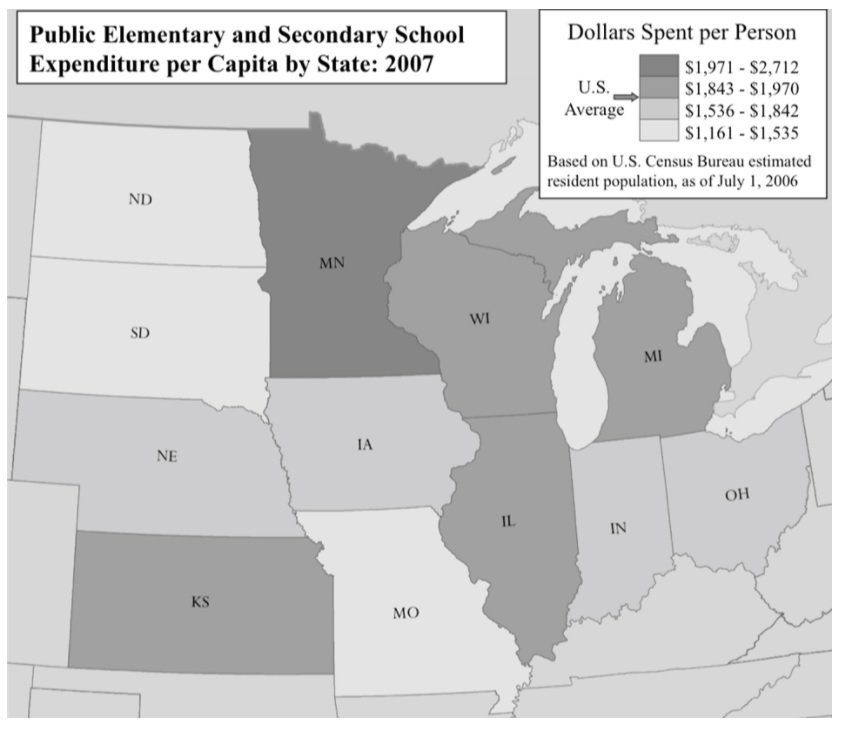
The graphic indicates the range of spend, per person, for public elementary and secondary school education in various Midwestern states in the United States in 2007.

Use the drop-down menus to complete each statement according to the information presented in the diagram.
1. If, in 2007, the population of Minnesota (MN) was 5.2 million and the population of South Dakota (SD) was 0.8 million, then the range of possible total expenditure on public elementary and secondary school education in South Dakota was approximately of the equivalent range for Minnesota.
2. If, in 2007 in the state of Wisconsin (WI), all schools spent either the minimum or the maximum per person, and 2.5 times as many schools spent the minimum as the maximum, the average spend per person for Wisconsin in 2007 was approximately .

2 (4).jpg [ 50.61 KiB | Viewed 1992 times ]
Use the drop-down menus to complete each statement according to the information presented in the diagram.
1. If, in 2007, the population of Minnesota (MN) was 5.2 million and the population of South Dakota (SD) was 0.8 million, then the range of possible total expenditure on public elementary and secondary school education in South Dakota was approximately of the equivalent range for Minnesota.
2. If, in 2007 in the state of Wisconsin (WI), all schools spent either the minimum or the maximum per person, and 2.5 times as many schools spent the minimum as the maximum, the average spend per person for Wisconsin in 2007 was approximately .
Attachment:
2 (4).jpg [ 50.61 KiB | Viewed 1992 times ]
ShowHide Answer
Official Answer
Dropdown 1: 8%
Dropdown 2: $1879
Kudos
Bookmarks
1. There are four tiers of spending. Minnesota is in the highest while South Dakota is in the lowest. So, the percent ratio is equal to \(\frac{Lowest \ Tier \ Range * SD \ Population}{Highest \ Tier \ Range * MN \ Population} * 100\% = \frac{(1535 - 1161) * 0.8 \ million}{(2712 - 1971) * 5.2 \ million} * 100\% \approx 0.0776 * 100\% = 7.76\%\), which is closest to 8%.
2. Wisconsin is in the second-highest tier, which has a maximum of $1970 and a minimum of $1843. Let there be n schools that spent the maximum. Then, 2.5n spent the minimum. The average spend per person is \(\frac{n * 1970 + 2.5n * 1843}{3.5n} = \frac{1970 + 4607.5}{3.5} \approx 1879\).
3. Our answer will be: D1 - 8% and D2 - $1879.


