Events & Promotions
|
|

GMAT Club Daily Prep
Thank you for using the timer - this advanced tool can estimate your performance and suggest more practice questions. We have subscribed you to Daily Prep Questions via email.
Customized
for You
Track
Your Progress
Practice
Pays
Not interested in getting valuable practice questions and articles delivered to your email? No problem, unsubscribe here.
 Jun 10
06:00 AM PDT
-06:15 PM PDT
Register for the GMAT Club Virtual MBA Spotlight Fair – the world’s premier event for serious MBA candidates. This is your chance to hear directly from Admissions Directors at nearly every Top 30 MBA program..

ConsultingOrBust
Joined: 29 Jan 2014
Last visit: 18 Nov 2019
Posts: 131
Given Kudos: 28
Location: United States
Concentration: Strategy, General Management
Schools: Stern '16 (M)
GMAT 1: 770 Q51 V44
WE:Analyst (Retail Banking)
Kudos
Bookmarks
| FROM MBA Data Guru: Stanford MBA Acceptance Rate Analysis |
|
Stanford MBA Acceptance Rate Analysis When I first built the Stanford MBA acceptance rate model, it showed that GPA had little to no impact on acceptance rate. I have reevaluated the data and now I believe that GPA does matter when applying to Stanford. Although GPA does impact acceptance, GMAT is still more important for Stanford MBA admissions. Stanford MBA Acceptance Rate by GMAT 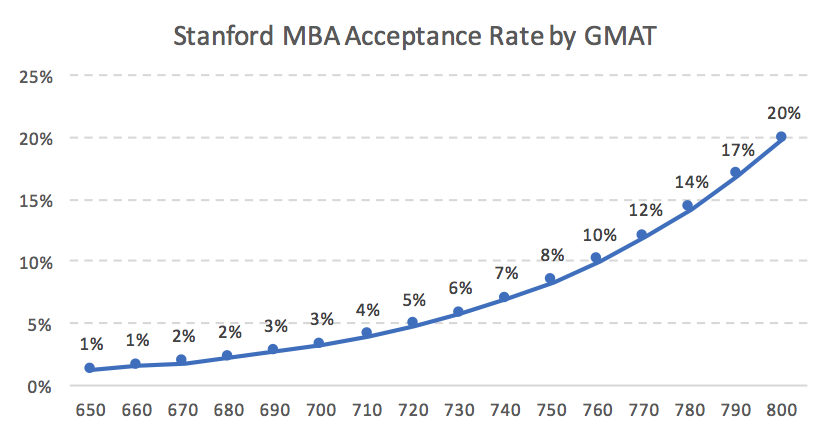 GMAT is very important when applying to Stanford’s business school. When an applicant increases their GMAT by 100 points from 650 to 750, they increase their chance of admission 8 fold. Average GMAT is over 730 points which means an applicant must have a very high GMAT for their acceptance rate to be in the double digits. Stanford MBA Acceptance Rate by GPA 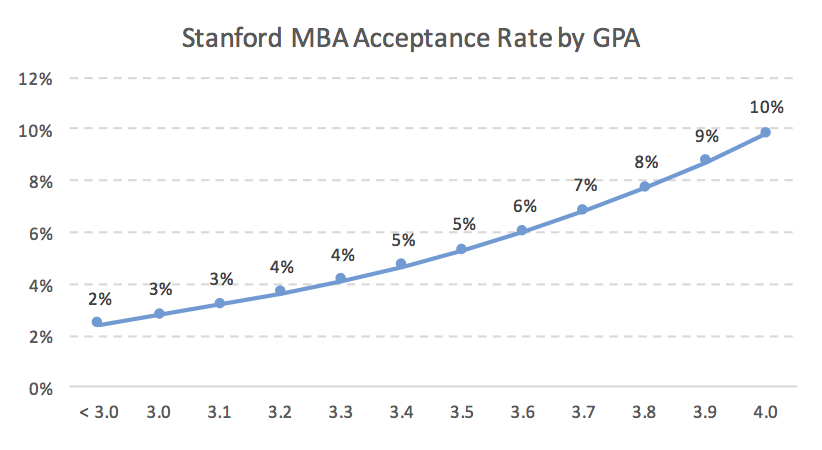 My new analysis demonstrates that GPA is actually important when applying to Stanford GSB. The average GPA of a Stanford applicant is 3.56. Each “.10” increase in GPA raises acceptance rate at Stanford by approximately 1%. Stanford MBA Acceptance Rate GMAT vs. GPA 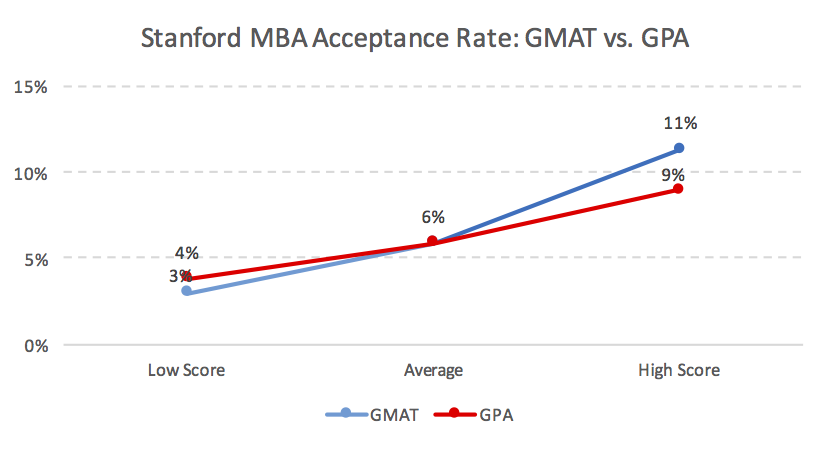 Although both GMAT and GPA are important factors that influence an applicant’s chance of admission to Stanford Graduate School of Business, GMAT is more important than GPA. A high GMAT increases acceptance rate at Stanford by 5%*. On the other hand, a high GPA only increase acceptance rate by 3%. I was not happy with the original predictive model I built for Stanford. I updated my methodology for building the model, mainly in the way I cleaned the data. The results above represent my new model. Below I compare the performance of the old and new model. Original Stanford MBA Model Performance 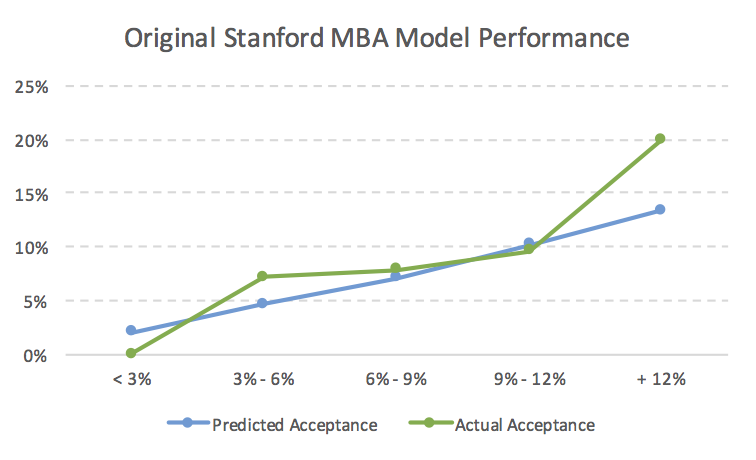 Although the graph above looks like it does a good job of predicting the acceptance rate at Stanford. The results are deceptive because almost all of the population fall into the 3% – 6% or 6% – 9% groups, which have little separation. New Stanford MBA Model Performance 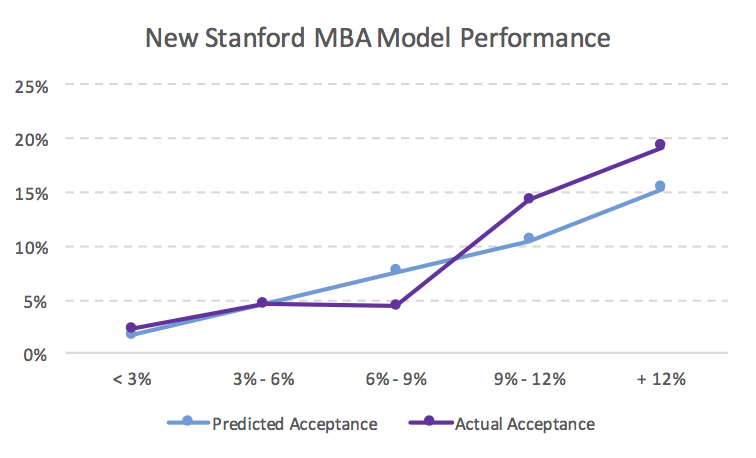 The new model clearly shows significant differentiation, with the exception of the 6% – 9% group. The biggest problem is that 6% – 9% population acceptance rate is over estimated and the above 9% population is under estimated. The main difference between the original model and new model is the distribution of predictions seen below. Stanford MBA Model Distribution: New vs. Old 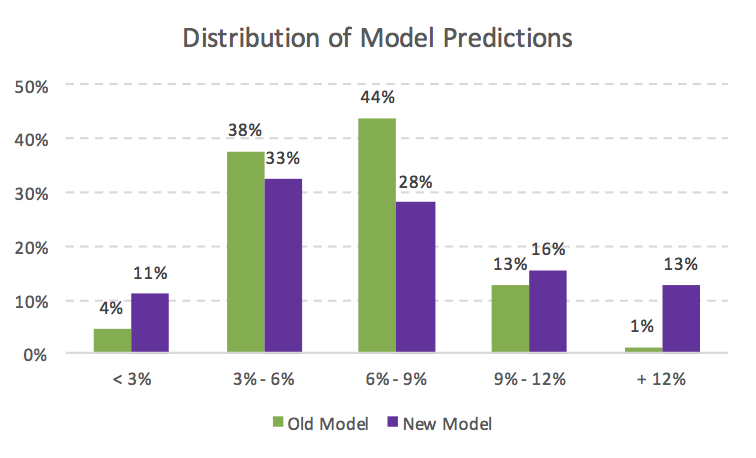 In the original model, 82% of all applicants fell into the 3% to 9% range with only 5% of applicants below 3% or above 12%. The new model has a much more even distribution of applicants. The low and high acceptance rate applicants has increased from 5% to 24%. Data used to create this post came from GMAT Club, which is one of the best websites for preparing for the GMAT. *A high GMAT or high GPA is defined as one standard deviation above average. A low score is defined as one standard deviation below. MBA Data Guru - Business school admissions data and analysis |
This Blog post was imported into the forum automatically. We hope you found it helpful. Please use the Kudos button if you did, or please PM/DM me if you found it disruptive and I will take care of it.
-BB
Archived Stanford Discussion
Hi there,
You've stumbled upon an old discussion from our Stanford Forum
that's now outdated and has been archived. No more replies are possible here.
Interested in current discussions? Feel free to dive into our dedicated Stanford Forum
for all fresh things related to the Stanford MBA program.
Thank you for understanding, and happy exploring!
Kudos
Bookmarks
I find it hard to believe that 20% of applicants had 800 GMAT.
"Set the low visibility detail, set the low visibility detail."
"Set the low visibility detail, set the low visibility detail."


Kudos
Bookmarks
Archived Stanford Discussion
Hi there,
You've stumbled upon an old discussion from our Stanford Forum
that's now outdated and has been archived. No more replies are possible here.
Interested in current discussions? Feel free to dive into our dedicated Stanford Forum
for all fresh things related to the Stanford MBA program.
Thank you for understanding, and happy exploring!

