Events & Promotions
|
|

GMAT Club Daily Prep
Thank you for using the timer - this advanced tool can estimate your performance and suggest more practice questions. We have subscribed you to Daily Prep Questions via email.
Customized
for You
Track
Your Progress
Practice
Pays
Not interested in getting valuable practice questions and articles delivered to your email? No problem, unsubscribe here.
 May 03
12:30 AM EDT
-01:30 AM EDT
Learn how Kamakshi achieved a GMAT 675 with an impressive 96th %ile in Data Insights. Discover the unique methods and exam strategies that helped her excel in DI along with other sections for a balanced and high score. May 03
01:30 AM EDT
-02:30 AM EDT
Struggling to find the right strategies to score a 99 %ile on GMAT Focus? Riya (GMAT 715) boosted her score by 100-points in just 15 days! Discover how the right mentorship, tailored strategies, and an unwavering mindset can transform your GMAT prep. May 03
06:30 AM PDT
-08:30 AM PDT
Verbal trouble on GMAT? Fix it NOW! Join Sunita Singhvi for a focused webinar on actionable strategies to boost your Verbal score and take your performance to the next level. May 05
10:00 AM PDT
-11:00 AM PDT
GMAT Inequalities is a high-frequency topic in GMAT Quant, but many students struggle because the concepts behave differently from standard algebra. Understanding the right rules, patterns, and edge cases can significantly improve both speed and accuracy.- May 06
08:30 AM PDT
-09:30 AM PDT
In Episode 3 of our GMAT Ninja Critical Reasoning series, we tackle Discrepancy, Paradox, and Explain an Oddity questions. You know the feeling: the passage gives you two facts that seem completely contradictory.... - May 08
08:00 AM PDT
-08:30 AM PDT
Join the special YouTube live-stream for selecting the winners of GMAT Club MBA Scholarships sponsored by Juno live. Watch who gets these coveted MBA scholarships offered by GMAT Club and Juno.

Kudos
Bookmarks

Dropdown 1: 1.5
Dropdown 2: advanced opportunities
Be sure to select an answer first to save it in the Error Log before revealing the correct answer (OA)!
Difficulty:
 15%
(low)
15%
(low)
Question Stats:
84% (02:48) correct 16%
(03:10)
wrong
based on 1159
sessions
16%
(03:10)
wrong
based on 1159
sessions
History
Date
Time
Result
Not Attempted Yet
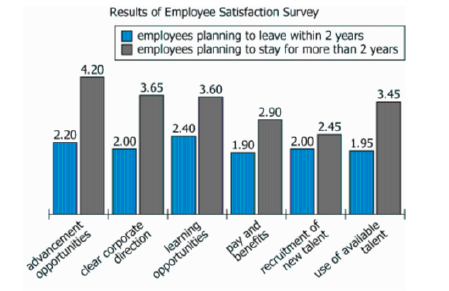
In a company's recent employee satisfaction survey, each employee was asked to rate his or her satisfaction in each of 6 categories on a scale from 1 (lowest) to 6 (highest) and was asked to indicate whether he or she had plans to leave the company within the next 2 years. For each category, the graph shows the average (arithmetic mean) rating given by employees planning to leave within 2 years and the average rating given by employees planning to stay for more than 2 years.
Select from each drop-down menu the option that creates the most accurate statement based on the information provided.
For the 6 categories, the median of the average ratings given by employees planning to stay for more than 2 years was greater than that for employees planning to leave within 2 years by approximately .
Among the 6 categories, the absolute value of the difference between the average rating given by employees planning to stay for more than 2 years and the average rating given by employees planning to leave within 2 years was greatest for .
ID: 101122
ShowHide Answer
Official Answer
Dropdown 1: 1.5
Dropdown 2: advanced opportunities
Solving this question helps.
Taking a timed set of similar questions in
GMAT Club Forum Quiz →
is even better.

jack5397

Joined: 13 Sep 2020
Last visit: 15 May 2025
Posts: 139
Given Kudos: 278
Location: India
Concentration: General Management, Strategy
Schools: ISB '27 IIMA '26 INSEAD '26
GMAT Focus 1: 575 Q79 V79 DI77 
GMAT Focus 2: 575 Q80 V81 DI75
GMAT Focus 3: 635 Q82 V83 DI79 
GMAT 1: 460 Q36 V18 (Online)
GPA: 3.8
Products:
Kudos
Bookmarks
Hi @guddo
Second drop down should be advancement opportunities because absolute difference is 2 and learning opportunities is 1.2
Can you pls confirm the OA ?
Thanks
Second drop down should be advancement opportunities because absolute difference is 2 and learning opportunities is 1.2
Can you pls confirm the OA ?
Thanks