Events & Promotions
|
|

GMAT Club Daily Prep
Thank you for using the timer - this advanced tool can estimate your performance and suggest more practice questions. We have subscribed you to Daily Prep Questions via email.
Customized
for You
Track
Your Progress
Practice
Pays
Not interested in getting valuable practice questions and articles delivered to your email? No problem, unsubscribe here.
 Apr 27
11:00 AM EDT
-12:00 PM EDT
Prefer video-based learning? The Target Test Prep OnDemand course is a one-of-a-kind video masterclass featuring 400 hours of lecture-style teaching by Scott Woodbury-Stewart, founder of Target Test Prep and one of the most accomplished GMAT instructors Apr 26
01:30 AM EDT
-02:30 AM EDT
Learn how Keshav, a Chartered Accountant, scored an impressive 705 on GMAT in just 30 days with GMATWhiz's expert guidance. In this video, he shares preparation tips and strategies that worked for him, including the mock, time management, and more. Apr 26
10:00 AM EDT
-11:00 AM EDT
The Target Test Prep course represents a quantum leap forward in GMAT preparation, a radical reinterpretation of the way that students should study. Try before you buy with a 5-day, full-access trial of the course for FREE! Apr 28
08:00 AM PDT
-11:00 AM PDT
Whether you are just beginning your MBA journey or fine-tuning your path to a 700+ score, GMAT Day is designed to give you a competitive edge. Apr 29
12:30 AM EDT
-01:30 AM EDT
Learn how Kamakshi achieved a GMAT 675 with an impressive 96th %ile in Data Insights. Discover the unique methods and exam strategies that helped her excel in DI along with other sections for a balanced and high score. May 01
11:00 AM PDT
-12:00 PM PDT
Free- full-length test + 15 concept videos + 150+ short videos + study plan! May 03
06:30 AM PDT
-08:30 AM PDT
Verbal trouble on GMAT? Fix it NOW! Join Sunita Singhvi for a focused webinar on actionable strategies to boost your Verbal score and take your performance to the next level.


Originally posted by RonPurewal on 25 Feb 2026, 22:12.
Last edited by Bunuel on 12 Mar 2026, 07:22, edited 2 times in total.
Last edited by Bunuel on 12 Mar 2026, 07:22, edited 2 times in total.
Kudos
Bookmarks

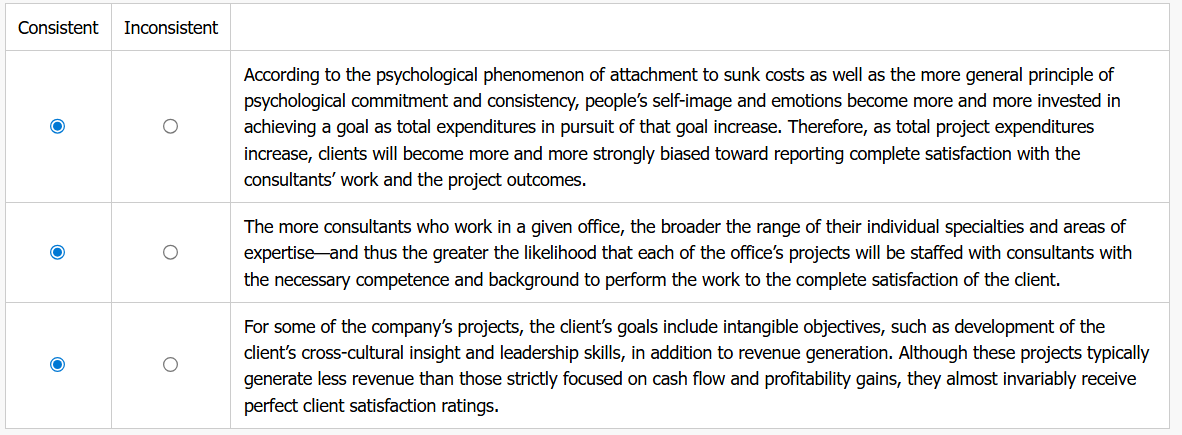
According to the psychological phenomenon of attachment to sunk costs as well as the more general principle of psychological commitment and consistency, people’s self-image and emotions become more and more invested in achieving a goal as total expenditures in pursuit of that goal increase. Therefore, as total project expenditures increase, clients will become more and more strongly biased toward reporting complete satisfaction with the consultants’ work and the project outcomes.: Consistent
The more consultants who work in a given office, the broader the range of their individual specialties and areas of expertise—and thus the greater the likelihood that each of the office’s projects will be staffed with consultants with the necessary competence and background to perform the work to the complete satisfaction of the client.: Consistent
For some of the company’s projects, the client’s goals include intangible objectives, such as development of the client’s cross-cultural insight and leadership skills, in addition to revenue generation. Although these projects typically generate less revenue than those strictly focused on cash flow and profitability gains, they almost invariably receive perfect client satisfaction ratings.: Consistent
Be sure to select an answer first to save it in the Error Log before revealing the correct answer (OA)!
Difficulty:
 95%
(hard)
95%
(hard)
Question Stats:
39% (02:50) correct 61%
(03:05)
wrong
based on 191
sessions
61%
(03:05)
wrong
based on 191
sessions
History
Date
Time
Result
Not Attempted Yet

A consulting firm tracks performance metrics for eight regional offices, four in each of two geographic regions (East and West). The following table contains these metrics for calendar year 2019. This firm hires consultants for its regional offices on a calendar-year basis, so the number of consultants employed at each office listed did not change at any point during 2019.
Each of the following statements, if true, predicts the existence of a correlation between two of the metrics in the table. For each statement, select Consistent if the predicted correlation holds for the data in the table. Otherwise, select Inconsistent.
2019 Regional Office Performance Data
| Office | Region | Consultants | Projects Completed | Avg Project Revenue ($k) | Total Costs ($M) | Client Satisfaction (%) |
|---|---|---|---|---|---|---|
| A | West | 42 | 115 | 86 | 7.9 | 91 |
| B | East | 35 | 104 | 93 | 7.4 | 88 |
| C | West | 51 | 135 | 79 | 9.8 | 94 |
| D | East | 28 | 96 | 102 | 7.1 | 85 |
| E | East | 47 | 122 | 89 | 8.6 | 92 |
| F | East | 39 | 110 | 90 | 8.1 | 90 |
| G | West | 33 | 89 | 95 | 6.2 | 87 |
| H | West | 44 | 120 | 84 | 8.5 | 93 |
Each of the following statements, if true, predicts the existence of a correlation between two of the metrics in the table. For each statement, select Consistent if the predicted correlation holds for the data in the table. Otherwise, select Inconsistent.
| Consistent | Inconsistent | |
| According to the psychological phenomenon of attachment to sunk costs as well as the more general principle of psychological commitment and consistency, people’s self-image and emotions become more and more invested in achieving a goal as total expenditures in pursuit of that goal increase. Therefore, as total project expenditures increase, clients will become more and more strongly biased toward reporting complete satisfaction with the consultants’ work and the project outcomes. | ||
| The more consultants who work in a given office, the broader the range of their individual specialties and areas of expertise—and thus the greater the likelihood that each of the office’s projects will be staffed with consultants with the necessary competence and background to perform the work to the complete satisfaction of the client. | ||
| For some of the company’s projects, the client’s goals include intangible objectives, such as development of the client’s cross-cultural insight and leadership skills, in addition to revenue generation. Although these projects typically generate less revenue than those strictly focused on cash flow and profitability gains, they almost invariably receive perfect client satisfaction ratings. |
ShowHide Answer
Official Answer
According to the psychological phenomenon of attachment to sunk costs as well as the more general principle of psychological commitment and consistency, people’s self-image and emotions become more and more invested in achieving a goal as total expenditures in pursuit of that goal increase. Therefore, as total project expenditures increase, clients will become more and more strongly biased toward reporting complete satisfaction with the consultants’ work and the project outcomes.: Consistent
The more consultants who work in a given office, the broader the range of their individual specialties and areas of expertise—and thus the greater the likelihood that each of the office’s projects will be staffed with consultants with the necessary competence and background to perform the work to the complete satisfaction of the client.: Consistent
For some of the company’s projects, the client’s goals include intangible objectives, such as development of the client’s cross-cultural insight and leadership skills, in addition to revenue generation. Although these projects typically generate less revenue than those strictly focused on cash flow and profitability gains, they almost invariably receive perfect client satisfaction ratings.: Consistent
I32-11
Kudos
Bookmarks
A consulting firm tracks performance metrics for eight regional offices, four in each of two geographic regions (East and West). The following table contains these metrics for calendar year 2019. This firm hires consultants for its regional offices on a calendar-year basis, so the number of consultants employed at each office listed did not change at any point during 2019.
Each of the following statements, if true, predicts the existence of a correlation between two of the metrics in the table. For each statement, select Consistent if the predicted correlation holds for the data in the table. Otherwise, select Inconsistent.
Part I: “According to the psychological phenomenon of attachment to sunk costs as well as the more general principle of psychological commitment and consistency, people’s self-image and emotions become more and more invested in achieving a goal as total expenditures in pursuit of that goal increase. Therefore, as total project expenditures increase, clients will become more and more strongly biased toward reporting complete satisfaction with the consultants’ work and the project outcomes.”
In this statement there’s no possible confusion about the correlation being asserted: “as total project expenditures increase, clients will become more and more strongly biased toward reporting complete satisfaction.” So, we need to look for a positive correlation between Total Costs and Client Satisfaction Rate.
We can sort by either one of these two variables (for the same reason why it doesn’t matter which variable goes on the x-axis of a scatterplot, if we’re looking only for correlation). If we sort by Total Costs, the two columns of interest are as follows:
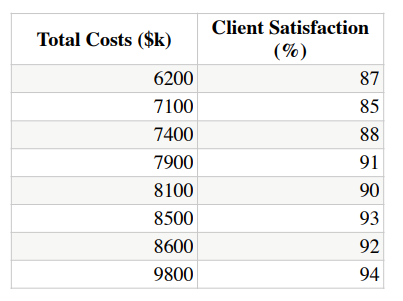
The positive correlation is obvious. (Note how all the percentages in the 80s come first, followed by all the ones in the 90s.) So this statement is Consistent with the table.
Part II: “The more consultants who work in a given office, the broader the range of their individual specialties and areas of expertise—and thus the greater the likelihood that each of the office’s projects will be staffed with consultants with the necessary competence and background to perform the work to the complete satisfaction of the client.”
The correlation ultimately being predicted here is between Number of Consultants (“the more consultants who work in a given office...”) and Client Satisfaction Rating (“...to the complete satisfaction of the client”). Sort by either of these and then check for the necessary (positive)
correlation.
If we sort by Number of Consultants, the results are as follows:
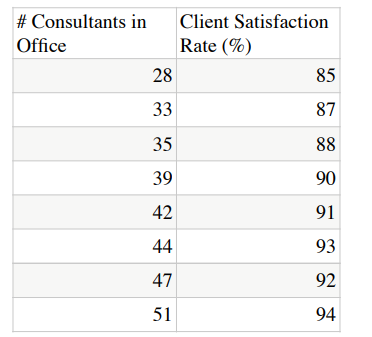
Once again, the positive correlation is obvious. (Were it not for the 93% and 92% values coming out of order, the correlation here would be perfect.) This statement is also Consistent with the table.
Part III: “For some of the company’s projects, the client’s goals include intangible objectives, such as development of the client’s cross-cultural insight and leadership skills, in addition to revenue generation. Although these projects typically generate less revenue than those strictly focused on cash flow and profitability gains, they almost invariably receive perfect client satisfaction ratings.”
We have no information whatsoever about project goals, so the relevant correlation is between the other two metrics mentioned here: Average Project Revenue (“these projects typically generate less revenue”) and “client satisfaction ratings”. So, we need to sort the rows by one of these variables (once again it doesn’t particularly matter which one), and then check to see whether the resulting columns are ANTI-correlated (as one goes up, the other goes down).
Here’s what we get from sorting by Average Project Revenue:
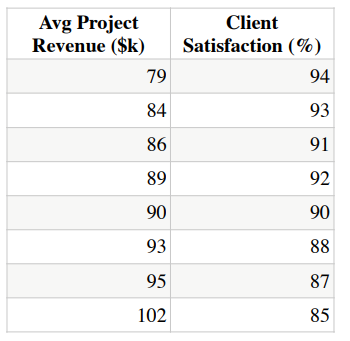
Just like last time, the desired correlation is as close as possible to perfect without actually being perfect (marred only by the 92% and 91% figures coming out of order). So this statement, too, is very much Consistent with the table.

GMAT-Club-Forum-xgwcceuy.png [ 84.49 KiB | Viewed 996 times ]

GMAT-Club-Forum-4gbafy7c.png [ 22.6 KiB | Viewed 966 times ]

GMAT-Club-Forum-22gmb6vy.png [ 21.52 KiB | Viewed 950 times ]

GMAT-Club-Forum-qa6qaofm.png [ 23.9 KiB | Viewed 936 times ]
2019 Regional Office Performance Data
| Office | Region | Consultants | Projects Completed | Avg Project Revenue ($k) | Total Costs ($M) | Client Satisfaction (%) |
|---|---|---|---|---|---|---|
| A | West | 42 | 115 | 86 | 7.9 | 91 |
| B | East | 35 | 104 | 93 | 7.4 | 88 |
| C | West | 51 | 135 | 79 | 9.8 | 94 |
| D | East | 28 | 96 | 102 | 7.1 | 85 |
| E | East | 47 | 122 | 89 | 8.6 | 92 |
| F | East | 39 | 110 | 90 | 8.1 | 90 |
| G | West | 33 | 89 | 95 | 6.2 | 87 |
| H | West | 44 | 120 | 84 | 8.5 | 93 |
Each of the following statements, if true, predicts the existence of a correlation between two of the metrics in the table. For each statement, select Consistent if the predicted correlation holds for the data in the table. Otherwise, select Inconsistent.
Part I: “According to the psychological phenomenon of attachment to sunk costs as well as the more general principle of psychological commitment and consistency, people’s self-image and emotions become more and more invested in achieving a goal as total expenditures in pursuit of that goal increase. Therefore, as total project expenditures increase, clients will become more and more strongly biased toward reporting complete satisfaction with the consultants’ work and the project outcomes.”
In this statement there’s no possible confusion about the correlation being asserted: “as total project expenditures increase, clients will become more and more strongly biased toward reporting complete satisfaction.” So, we need to look for a positive correlation between Total Costs and Client Satisfaction Rate.
We can sort by either one of these two variables (for the same reason why it doesn’t matter which variable goes on the x-axis of a scatterplot, if we’re looking only for correlation). If we sort by Total Costs, the two columns of interest are as follows:
The positive correlation is obvious. (Note how all the percentages in the 80s come first, followed by all the ones in the 90s.) So this statement is Consistent with the table.
Part II: “The more consultants who work in a given office, the broader the range of their individual specialties and areas of expertise—and thus the greater the likelihood that each of the office’s projects will be staffed with consultants with the necessary competence and background to perform the work to the complete satisfaction of the client.”
The correlation ultimately being predicted here is between Number of Consultants (“the more consultants who work in a given office...”) and Client Satisfaction Rating (“...to the complete satisfaction of the client”). Sort by either of these and then check for the necessary (positive)
correlation.
If we sort by Number of Consultants, the results are as follows:
Once again, the positive correlation is obvious. (Were it not for the 93% and 92% values coming out of order, the correlation here would be perfect.) This statement is also Consistent with the table.
Part III: “For some of the company’s projects, the client’s goals include intangible objectives, such as development of the client’s cross-cultural insight and leadership skills, in addition to revenue generation. Although these projects typically generate less revenue than those strictly focused on cash flow and profitability gains, they almost invariably receive perfect client satisfaction ratings.”
We have no information whatsoever about project goals, so the relevant correlation is between the other two metrics mentioned here: Average Project Revenue (“these projects typically generate less revenue”) and “client satisfaction ratings”. So, we need to sort the rows by one of these variables (once again it doesn’t particularly matter which one), and then check to see whether the resulting columns are ANTI-correlated (as one goes up, the other goes down).
Here’s what we get from sorting by Average Project Revenue:
Just like last time, the desired correlation is as close as possible to perfect without actually being perfect (marred only by the 92% and 91% figures coming out of order). So this statement, too, is very much Consistent with the table.
Attachment:
GMAT-Club-Forum-xgwcceuy.png [ 84.49 KiB | Viewed 996 times ]
Attachment:
GMAT-Club-Forum-4gbafy7c.png [ 22.6 KiB | Viewed 966 times ]
Attachment:
GMAT-Club-Forum-22gmb6vy.png [ 21.52 KiB | Viewed 950 times ]
Attachment:
GMAT-Club-Forum-qa6qaofm.png [ 23.9 KiB | Viewed 936 times ]
General Discussion

Kudos
Bookmarks
This is a Graphs and Tables correlation verification question — one of my favourite DI formats because it tests careful data reading rather than computation. The key skill: don't trust the story the statement tells you. Go straight to the numbers and check.
The question gives you a table of 8 offices and three statements, each predicting a correlation. You have to verify whether each correlation actually holds in the data.
The approach: For each statement, identify the two metrics being correlated, then check whether the predicted direction (positive or negative) is consistent across the table.
Statement 1 — Consistent
Prediction: Higher total costs → higher client satisfaction (sunk cost bias argument).
Sorting offices by total costs ascending: G (6.2M, 87%), D (7.1M, 85%), B (7.4M, 88%), A (7.9M, 91%), F (8.1M, 90%), H (8.5M, 93%), E (8.6M, 92%), C (9.8M, 94%). The trend is strongly upward. Out of all 28 pairwise comparisons, 25 are concordant (both variables move in the same direction) vs. only 3 discordant. Consistent.
Statement 2 — Consistent
Prediction: More consultants → higher client satisfaction (broader expertise).
Sorting by consultants: D (28, 85%), G (33, 87%), B (35, 88%), F (39, 90%), A (42, 91%), H (44, 93%), E (47, 92%), C (51, 94%). Nearly perfect — only one exception (H to E: 44 to 47 consultants, but satisfaction dips 93 to 92). 27 of 28 pairs are concordant. Consistent.
Statement 3 — Inconsistent
Prediction: Lower average project revenue → higher client satisfaction (intangible-goal projects generate less revenue but higher satisfaction). This predicts a negative correlation between revenue and satisfaction.
But check the data: sorting by avg revenue ascending — C (79k, 94%), H (84k, 93%), A (86k, 91%), E (89k, 92%), F (90k, 90%), B (93k, 88%), G (95k, 87%), D (102k, 85%). Satisfaction actually decreases as revenue decreases — they move together in the same direction, not opposite directions. 27 of 28 pairs run against the predicted negative correlation. Inconsistent.
Common trap: Reading the sunk-cost argument in Statement 1 and dismissing it as "that can't be real data" — on GMAT, you verify against the table, not against your intuition about causation. Similarly, Statement 3 sounds plausible as a business theory, but the data flatly contradicts it.
Takeaway: In G&T correlation questions, translate each statement into a predicted direction (positive or negative), sort the data by one variable, then check whether the other variable moves the way the statement predicts.
(Kavya | 725 on GMAT Focus Edition)


