Events & Promotions
|
|

GMAT Club Daily Prep
Thank you for using the timer - this advanced tool can estimate your performance and suggest more practice questions. We have subscribed you to Daily Prep Questions via email.
Customized
for You
Track
Your Progress
Practice
Pays
Not interested in getting valuable practice questions and articles delivered to your email? No problem, unsubscribe here.
 Jun 10
06:00 AM PDT
-06:15 PM PDT
Register for the GMAT Club Virtual MBA Spotlight Fair – the world’s premier event for serious MBA candidates. This is your chance to hear directly from Admissions Directors at nearly every Top 30 MBA program..


Kudos
Bookmarks

Dropdown 1: 2011
Dropdown 2: 2010
Be sure to select an answer first to save it in the Error Log before revealing the correct answer (OA)!
Difficulty:
 95%
(hard)
95%
(hard)
Question Stats:
34% (02:58) correct 66%
(02:42)
wrong
based on 405
sessions
66%
(02:42)
wrong
based on 405
sessions
History
Date
Time
Result
Not Attempted Yet
EDITED VERSION OF THIS QUESTION IS HERE: the-chart-shows-a-company-s-performance-from-2019-to-2024-sales-and-445396.html
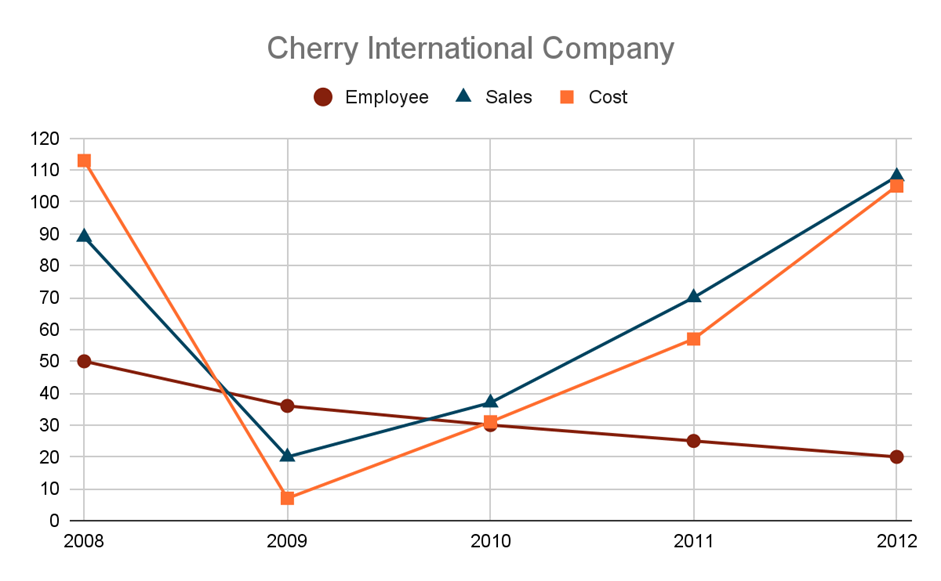
Cherry International Company is a leading business firm dealing in various products. The graph above shows the change in the strength of employees, sales and cost incurred by the company over a period of 5 years.
Profit of the company is the difference in sales and cost, that is Profit = Sales-Cost.
The values of cost and sales in Billion dollars and the number of employees in thousands. So, 20 thousand employees were working in the year 2012, while the sales of the company and the cost incurred by the company were $ 108 billion and $ 105 billion respectively.
From each drop down menu, select the option that creates the most accurate statement based on the graph and information above.
The profit per employee is the highest in , while the maximum percentage change in the cost has been in

GMAT-Club-Forum-aae1pjss.png [ 91.5 KiB | Viewed 1331 times ]
Data Insights (DI) Butler 2024 [ Date: 16-Feb-2023]
Cherry International Company is a leading business firm dealing in various products. The graph above shows the change in the strength of employees, sales and cost incurred by the company over a period of 5 years.
Profit of the company is the difference in sales and cost, that is Profit = Sales-Cost.
The values of cost and sales in Billion dollars and the number of employees in thousands. So, 20 thousand employees were working in the year 2012, while the sales of the company and the cost incurred by the company were $ 108 billion and $ 105 billion respectively.
From each drop down menu, select the option that creates the most accurate statement based on the graph and information above.
The profit per employee is the highest in , while the maximum percentage change in the cost has been in
Attachment:
GMAT-Club-Forum-aae1pjss.png [ 91.5 KiB | Viewed 1331 times ]
Archived Topic
Hi there,
This topic has been closed and archived due to inactivity or violation of community quality standards. No more replies are possible here.
Where to now? Join ongoing discussions on thousands of quality questions in our Graphs and Tables (G&T) Forum
Still interested in this question? Check out the "Best Topics" block below for a better discussion on this exact question, as well as several more related questions.
Thank you for understanding, and happy exploring!
ShowHide Answer
Official Answer
Dropdown 1: 2011
Dropdown 2: 2010

Kudos
Bookmarks
Where is the graph?

Kudos
Bookmarks
In Dropdown 2, the answer given is 2011.
On further analysis of the given graph in the question, the unit increase is about 18, [20--->38] accounting for 90% increase in 2010.
the unit increase is 32, [38---->70] accounting for a 84% increase in 2011.
So, shouldn't the answer be 2010 for dropdown 2?
On further analysis of the given graph in the question, the unit increase is about 18, [20--->38] accounting for 90% increase in 2010.
the unit increase is 32, [38---->70] accounting for a 84% increase in 2011.
So, shouldn't the answer be 2010 for dropdown 2?


