Events & Promotions
|
|

GMAT Club Daily Prep
Thank you for using the timer - this advanced tool can estimate your performance and suggest more practice questions. We have subscribed you to Daily Prep Questions via email.
Customized
for You
Track
Your Progress
Practice
Pays
Not interested in getting valuable practice questions and articles delivered to your email? No problem, unsubscribe here.
 Jun 10
06:00 AM PDT
-06:15 PM PDT
Register for the GMAT Club Virtual MBA Spotlight Fair – the world’s premier event for serious MBA candidates. This is your chance to hear directly from Admissions Directors at nearly every Top 30 MBA program..- Jun 10
10:00 AM PDT
-11:00 AM PDT
Scoring 715 on the GMAT Focus Edition requires more than just learning formulas, memorizing concepts, or solving hundreds of questions. In this episode, Nishant shares how he improved his GMAT preparation by focusing on application of concepts, and more.  Jun 11
11:00 AM EDT
-01:00 PM EDT
TTP GMAT OnDemand gives serious students 400+ hours of expert video instruction, the full TTP course, AI support, weekly office hours, and a 715+ score guarantee—all built for elite GMAT score improvement. Jun 22
07:30 PM EDT
-09:30 PM EDT
Master the GMAT with expert live instruction, a personalized study plan, and real-time support. Includes 40 hours of online classes plus 6 months of access to the TTP GMAT OnDemand video course. Class date: Mon/Wed June 22, 2026 →August 26, 2026


Dropdown 1: Apparel
Dropdown 2: 2014
Be sure to select an answer first to save it in the Error Log before revealing the correct answer (OA)!
Difficulty:
 65%
(hard)
65%
(hard)
Question Stats:
69% (01:56) correct 31%
(01:45)
wrong
based on 631
sessions
31%
(01:45)
wrong
based on 631
sessions
History
Date
Time
Result
Not Attempted Yet
12 Days of Christmas 🎅 GMAT Competition with Lots of Questions & Fun
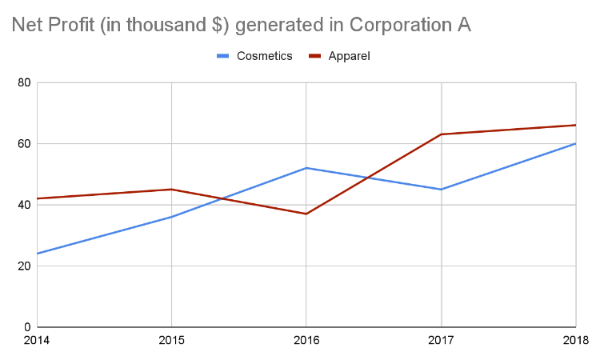
Corporation A has exactly two different divisions, one dealing in cosmetics and the other apparel. The line graph above shows the profit generated by the two divisions over a period of five years.
Select from each drop-down menu the option that creates the most accurate statement based on the information provided.
Based on the available information, it can be said that division in year had the maximum share of total profit in any given year.

12 Days of Christmas.png [ 31.5 KiB | Viewed 8478 times ]
|

Corporation A has exactly two different divisions, one dealing in cosmetics and the other apparel. The line graph above shows the profit generated by the two divisions over a period of five years.
Select from each drop-down menu the option that creates the most accurate statement based on the information provided.
Based on the available information, it can be said that division in year had the maximum share of total profit in any given year.
Attachment:
12 Days of Christmas.png [ 31.5 KiB | Viewed 8478 times ]
ShowHide Answer
Official Answer
Dropdown 1: Apparel
Dropdown 2: 2014


Kudos
Bookmarks
Corporation A has exactly two different divisions, one dealing in cosmetics and the other apparel. The line graph above shows the profit generated by the two divisions over a period of five years.
Select from each drop-down menu the option that creates the most accurate statement based on the information provided.
Based on the available information, it can be said that division in year had the maximum share of total profit in any given year.
Based on the available information, it can be said that division Apparel in year 2014 had the maximum share of total profit in any given year.
Select from each drop-down menu the option that creates the most accurate statement based on the information provided.
Based on the available information, it can be said that division in year had the maximum share of total profit in any given year.
| 2014 | 2015 | 2016 | 2017 | 2018 | |
| Apparel | 42 | 44 | 38 | 63 | 66 |
| Cosmetics | 24 | 36 | 52 | 45 | 60 |
| Total Profit | 66 | 80 | 90 | 108 | 126 |
| Max share of Total Profit | 63% | 55% | 57% | 58% | 52% |

Kudos
Bookmarks
Corporation A has exactly two different divisions, one dealing in cosmetics and the other apparel. Year wise profit share is tabulated below -
2014 : Apparel - 41 and Cosmetics - 22. Profit Share of Apparel = 41/(41+22) = 65%
2015 : Apparel - 44 and Cosmetics - 38. Profit Share of Apparel = 44/(44+38) = 55%
2016 : Apparel - 38 and Cosmetics - 50. Profit Share of Apparel = 38/(38+50) = 43% (=> Cosmetics share = 57%)
2017 : Apparel - 62 and Cosmetics - 44. Profit Share of Apparel = 62/(62+44) = 58%
2018 : Apparel - 64 and Cosmetics - 60. Profit Share of Apparel = 64/(64+60) = 51%
overall Apparel share of 65% is greater than cosmetics share of 57%.
Based on the available information, it can be said that division Apparel in year 2014 had the maximum share of total profit in any given year.


