Events & Promotions
|
|

GMAT Club Daily Prep
Thank you for using the timer - this advanced tool can estimate your performance and suggest more practice questions. We have subscribed you to Daily Prep Questions via email.
Customized
for You
Track
Your Progress
Practice
Pays
Not interested in getting valuable practice questions and articles delivered to your email? No problem, unsubscribe here.
 Jun 10
06:00 AM PDT
-06:15 PM PDT
Register for the GMAT Club Virtual MBA Spotlight Fair – the world’s premier event for serious MBA candidates. This is your chance to hear directly from Admissions Directors at nearly every Top 30 MBA program..

Kudos
Bookmarks
| FROM Cranfield SOM Blogs: What do you think of our library services? |
|
We want our students to have a great experience during their time at Cranfield. Each month, the University runs a short “Topic of the month” survey to focus on one service or facility and find out what you think of it. This month it is our turn! If you are a current student, please take a few minutes to complete the survey and tell us what you think of our library services. You can select the library you use the most – Kings Norton Library, the Management Information and Resource Centre (MIRC) or the Barrington Library. All your comments will be considered carefully to help improve the quality and usefulness of the services we offer. As a result of the feedback we received last year, we have made a number of changes to make your life easier:
Image from Pixabay |
This Blog post was imported into the forum automatically. We hope you found it helpful. Please use the Kudos button if you did, or please PM/DM me if you found it disruptive and I will take care of it.
-BB
Kudos
Bookmarks
| FROM Cranfield SOM Blogs: I look forward to the next four months… |
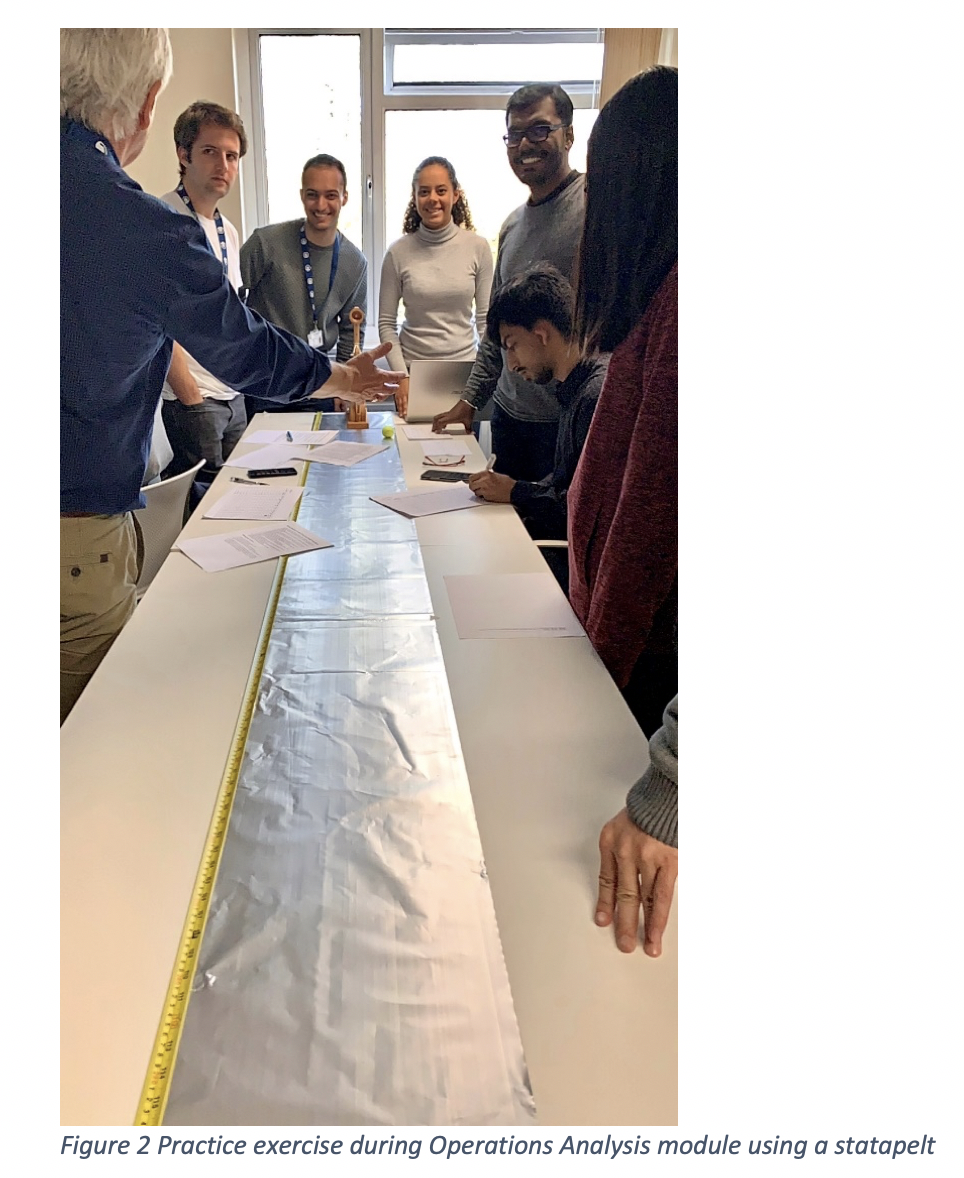
I am Mathilde, a French student who decided to complete a double degree at Cranfield University. I attended classes of Energy process and Energy transition in my French engineering school, the Ecole des Mines de Saint-Etienne and was eager to dig deeper in mechanics such as structural mechanics, optimization of machinery while continuing to learn more fundamental and applied physics. I knew Cranfield University thanks to the agreement with my school and, so started looking into their courses and soon found exactly the Master’s course I was looking for – one which linked energy and mechanical engineering. I applied and received an offer to study the MSc in Advanced Mechanical Engineering soon after. I applied for on-campus accommodation but unfortunately did not manage to get a room in time. Instead, I got a room in a very spacious shared house in Cranfield Village which after all satisfies me now since it is near the University and many people live there too. After four out of my eight modules, everything is going great so far. At the beginning of the year, we were greeted with diverse gathering events such as a welcoming ceremony where the director gave a speech in front of all students. There was also a barbecue with all Energy students, a quiz with SWEE students to know the campus better, and even parties hosted by the Cranfield Student Association. This was followed by induction week where we got to know each other, our course leaders and familiarise with the University and how it works. Then the real fun began. The structure of the first two months was the following: a one week of lectures and one week of self-study. Usually, this time is established to complete an assignment which permits us to deeply assimilate the previous week. Courses are rich due to their intensity but also because there are some external lecturers which allow to better understand their field and work. I also had two exams before going to the Christmas holidays.  I am currently into the Computational Fluid Dynamic for renewable energy module which is part of the applied modules. It means that it is expanded to two weeks of lectures and practice at the same time. In addition, my colleagues, my tutor and I are also preparing the subject for the group project which we have chosen to be linked with industry. I do not know precisely in which field of energy I want to work later. However, thanks to the courses, the lectures and the reflection that self-study time gives you and seeking of group project subject, I have started to acquire a better understanding of what could be my individual thesis project and my future job.  I am very happy with my four months spent so far because, in addition to learning about different cultures, varying and complementary ways of learning, this course has given me a real deepening of my scientific knowledge applied in the field of energy. Moreover, professors presenting this formation are real experts in their field. They provide high-level training and advanced research on advanced materials, structures and implementation processes for energy and power. I look forward to the next four months. |
This Blog post was imported into the forum automatically. We hope you found it helpful. Please use the Kudos button if you did, or please PM/DM me if you found it disruptive and I will take care of it.
-BB
Kudos
Bookmarks
| FROM Cranfield SOM Blogs: Data driven innovation in coastal resilience: Cranfield at the AAAS, Seattle |
|
Plans are in place for the Cranfield input to the upcoming ‘American Association for the Advancement of Science’ (AAAS) annual conference in Seattle in February. Ron Corstanje and Stephen Hallett [Link], who are serving as the UKRI/NERC ‘Constructing a Digital Environment’ (CDE) ‘Digital Environment Champions’, have been asked to play a key role in the UKRI presence at this years AAAS conference and exhibition, one of the biggest science gatherings worldwide. We are planning both to present a presentation workshop on ‘Data-driven Innovations in Coastal Resilience Assessment: USA and UK Perspectives’ [Link], and to host an exhibition on the UKRI stand of our research – in particular entering around our Virtual Reality big data presentation suite – configured to showcase some of our coastal research, and to be demonstrated by Cranfield’s Ian Truckell. The exhibition seeks to showcase British science and technology with a number of practical demonstrators. So in addition to the VR tools, we have been developing some Artificial Intelligence and environmental sensing demonstrators using a number of the powerful new ‘Raspberry Pi 4’ computer [Link] (Raspberry Pi itself being a great British tech company success story). The key focus of our presentations and exhibition will be on coastal resilience, and working with colleagues from Louisiana State University to contrast some of the issues and management responses between US and UK fragile coastlines. Managing our coastlines for resilience Coastlines are one of our most dynamic environments, where the multiplicity of management options are bought into sharp focus against often rapidly changing coastal processes, and the many competing pressures. Creation of resilience in coastal areas is now widely acknowledged to be a core requirement of sustainable coastal management practices. In the UK, management of coastlines is governed through Shoreline Management Plans (SMPs), which provide a large-scale assessment of the risks associated with coastal processes, and which seek to reduce these risks to people and the developed, historic and natural environments. An SMP determines the natural forces shaping the shoreline to assess how they are likely to change over the next 100 years, taking account of the condition of existing defences. The SMP develops policies outlining how the shoreline should be managed in the future, balancing the scale of the risks with the social, environmental and financial costs involved, and avoiding adverse impacts on adjacent coastal areas. 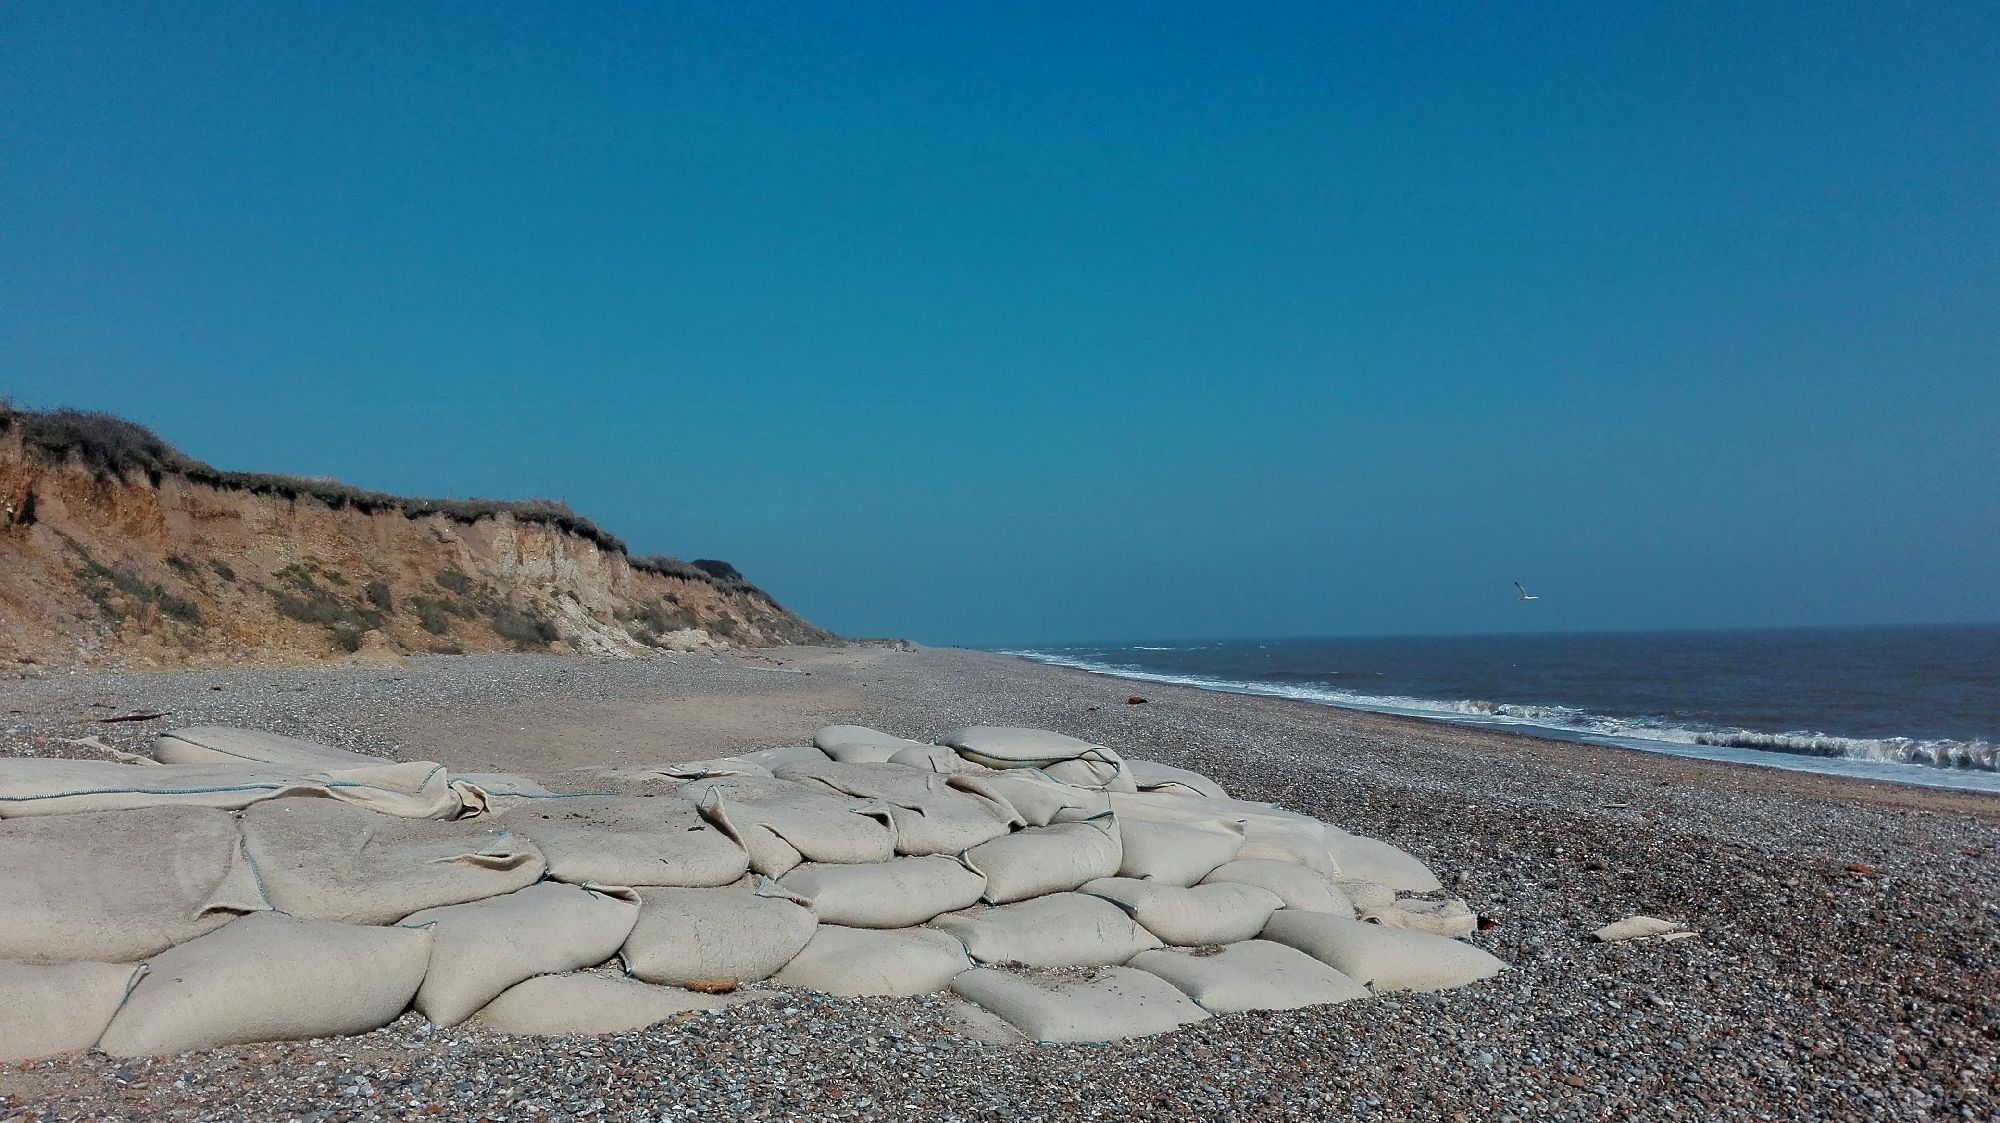 Coastal erosion management, Suffolk UK Coastal zones attract human settlement, business and industry, and are instrumental to the functioning of societies both in coastal states and the wider global community. However, the oceans and coasts are under growing pressure as human practices change, populations rise and climate change impacts increase. In managing coastal regions, high quality data forms the basis of rational decision-making. Large volumes of ‘triple bottom line’ data exists representing a wide variety of environmental, social, and economic themes in coastal regions. Such data is especially crucial to development of environmental risk evaluations for the coast. Decision-making and environmental management in coastal areas requires the ability to understand and quantify the variability of change and deformation of beaches and cliffs over time. An understanding of their drivers may be gained through the quantification of such changes. Today, rapidly advancing surveying technologies, capable of generating high resolution bathymetric and topographic data, allow precise measurements of geomorphological change and deformation in coastal regions, permitting great accuracy in the characterisation of volumetric change, sediment and debris flows, accumulations and erosion rates. However, such data is underutilised by coastal practitioners in their assessments of coastal change, due to a lack of awareness of the appropriate analytical techniques and the potential benefits offered by such data-driven approaches. Emergent proximal and remote sensing technologies are able to generate far higher spatio-temporal resolution measurements for coastal areas than have been previously available, in both the vertical and horizontal planes. Such methods can allow more precise measurements of coastal retreat to be undertaken than those extrapolated from traditional topographic maps or aerial photos. Material sources: https://suffolksmp2.org.uk/ https://doi.org/10.1016/j.ocecoaman.2019.105004 https://doi.org/10.1016/j.ocecoaman.2019.104875 https://doi.org/10.1016/j.ocecoaman.2018.04.015 |
This Blog post was imported into the forum automatically. We hope you found it helpful. Please use the Kudos button if you did, or please PM/DM me if you found it disruptive and I will take care of it.
-BB