Events & Promotions
|
|

GMAT Club Daily Prep
Thank you for using the timer - this advanced tool can estimate your performance and suggest more practice questions. We have subscribed you to Daily Prep Questions via email.
Customized
for You
Track
Your Progress
Practice
Pays
Not interested in getting valuable practice questions and articles delivered to your email? No problem, unsubscribe here.
 Sep 15
07:00 PM EDT
-09:00 PM EST
Elite scores are possible when you enroll in a powerful GMAT course, taught live online + 6 months access to TTP OnDemand video courses included! Class starts Tues/Thurs Sept. 15, 2026 - Nov. 15, 2027, 7:00pm-9:00pm EST Sep 21
07:00 PM EDT
-10:00 PM EDT
Boost your GMAT score in less than one month in a live online class + 6 months access to TTP OnDemand video courses included! Class starts Mon, Tues, Wed, Thur, Fri Sept. 21, 2026 - Oct. 9, 2027, 7:00pm-10:00pm EST



 11 Jun 2026, 06:16
Kudos
Bookmarks
Bellagio
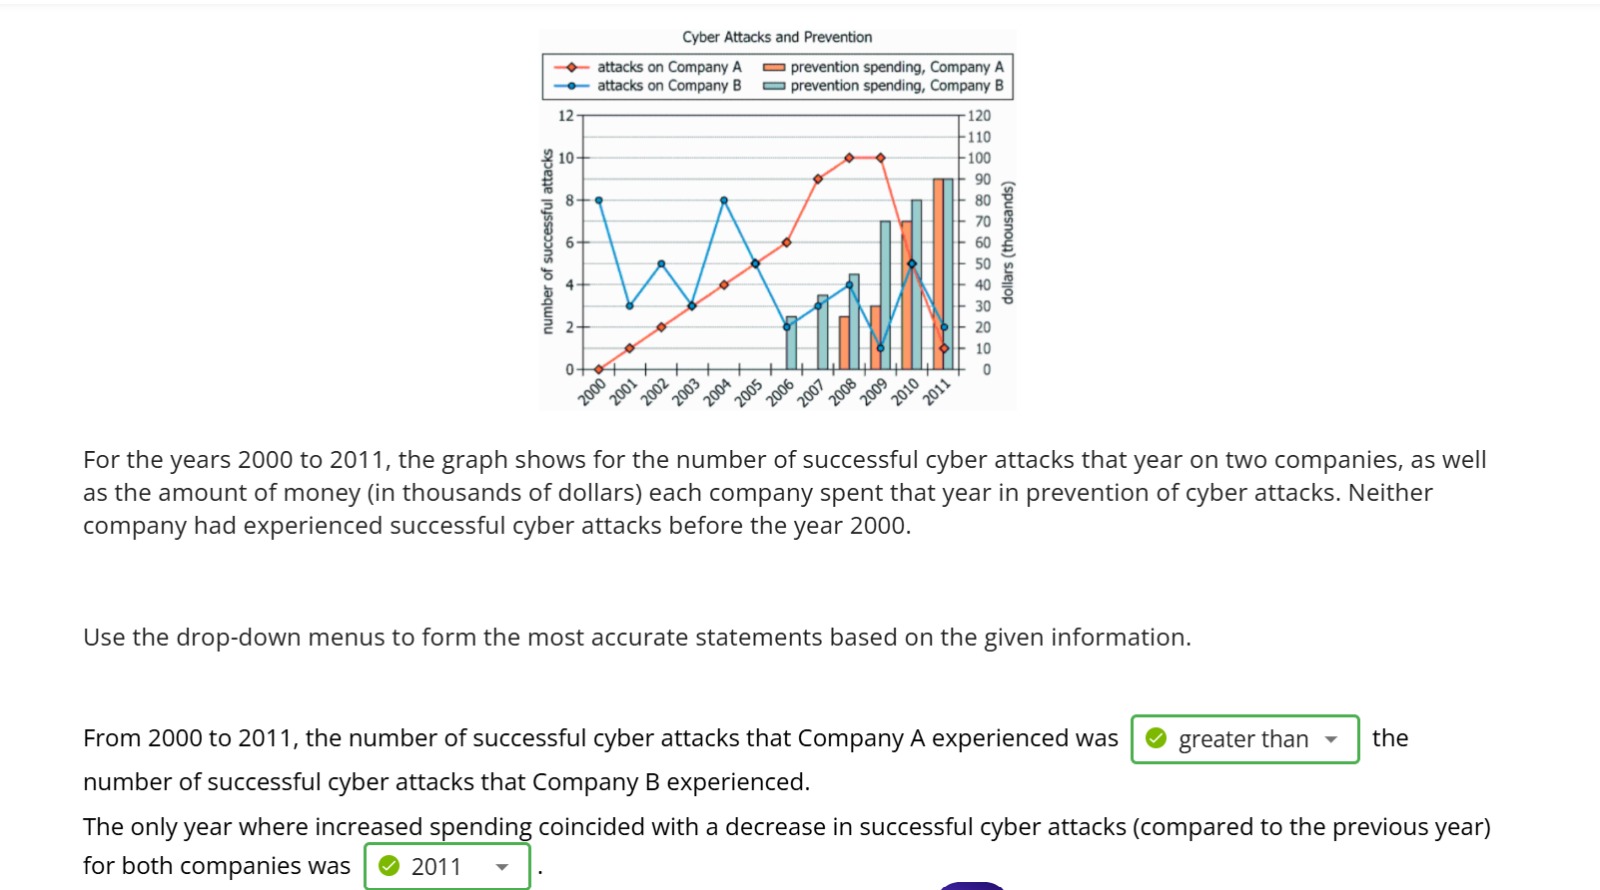
I wouldn’t actually calculate all the differences. A faster approach is to look at the area between the two lines. Before the lines cross, the blue line (Company B) is above the orange line (Company A), so Company B has more attacks during that period. However, the gap between the lines is relatively small. After the crossover, the orange line stays above the blue line by a larger margin. Visually, the area where the orange line is above the blue line is larger than the area where the blue line is above the orange line. That tells us that the earlier advantage for Company B is more than offset later, so overall Company A has a higher total number of cyber attacks. It’s mostly a visual estimation and can be done much faster than adding up all the yearly differences.
 11 Jun 2026, 13:20
Kudos
Bookmarks
WA@boj6690
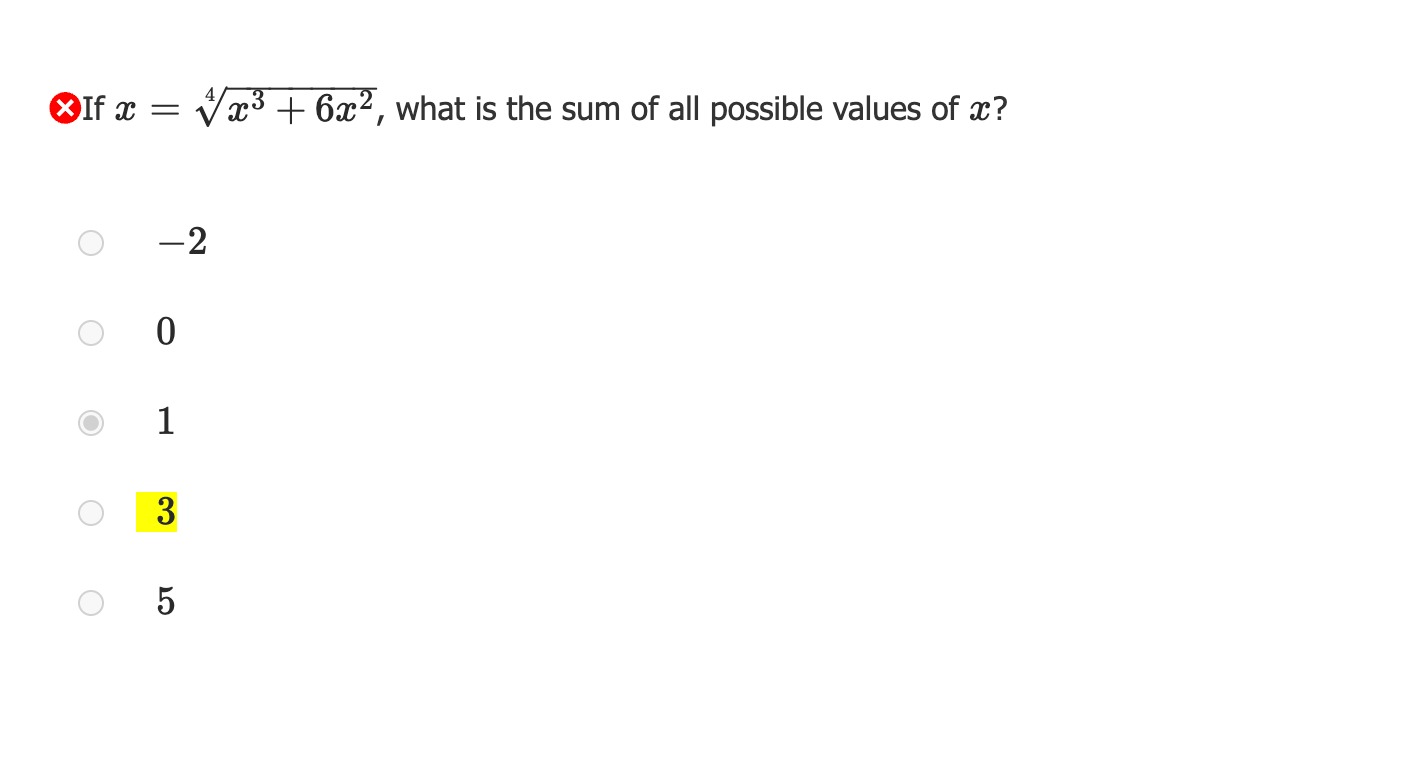
This question is discussed in detail here: https://gmatclub.com/forum/d01-183474.html Hope it helps.
11 Jun 2026, 13:20
Kudos
Bookmarks
Bellagio
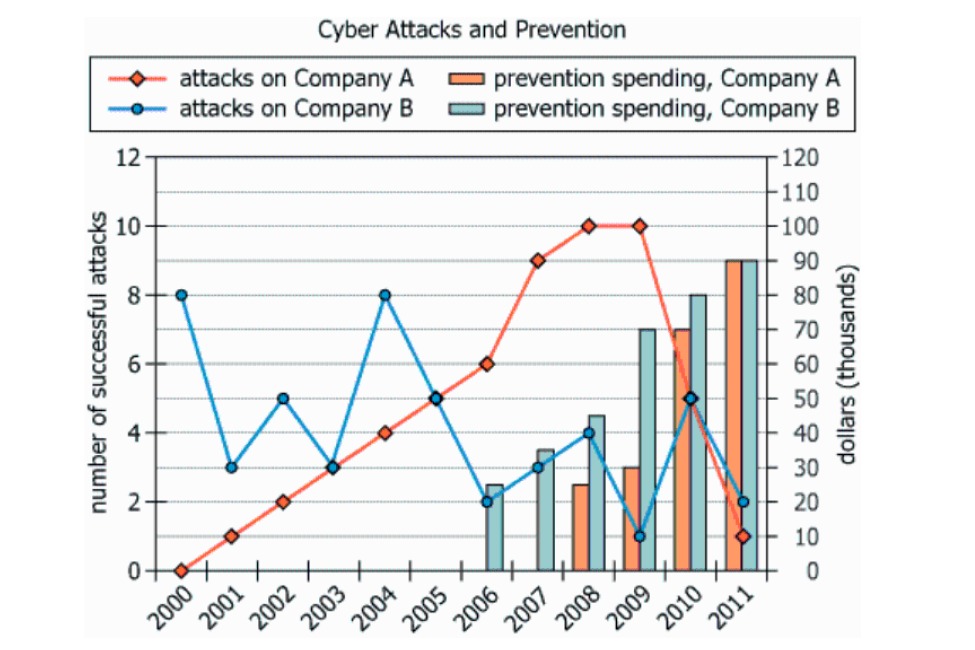
This question is discussed here: https://gmatclub.com/forum/for-the-year ... 30879.html Hope it helps.