Events & Promotions
|
|

GMAT Club Daily Prep
Thank you for using the timer - this advanced tool can estimate your performance and suggest more practice questions. We have subscribed you to Daily Prep Questions via email.
Customized
for You
Track
Your Progress
Practice
Pays
Not interested in getting valuable practice questions and articles delivered to your email? No problem, unsubscribe here.
 Jun 04
08:30 AM PDT
-09:30 AM PDT
For most test takers, Data Insights is the most challenging section on the GMAT, with test takers scoring several points lower on average on DI than on Quant or Verbal and completing the section with less time to spare. May 29
10:00 AM IST
-11:00 PM IST
Start your journey with a fully customized action plan and work with a dedicated mentor to achieve a 735+ score.- Jun 03
08:30 AM PDT
-09:30 AM PDT
In Episode 7 of our GMAT Ninja CR series, we are rounding up the oddballs, the misfits, and the format-benders: EXCEPT, Fill-In-The-Blanks, and other unusual Critical Reasoning question types. When you see a question that ends with a literal blank line - Jun 10
06:00 AM PDT
-06:15 PM PDT
Register for the GMAT Club Virtual MBA Spotlight Fair – the world’s premier event for serious MBA candidates. This is your chance to hear directly from Admissions Directors at nearly every Top 30 MBA program..


Kudos
Bookmarks
Dropdown 1: majority
Dropdown 2: northeast
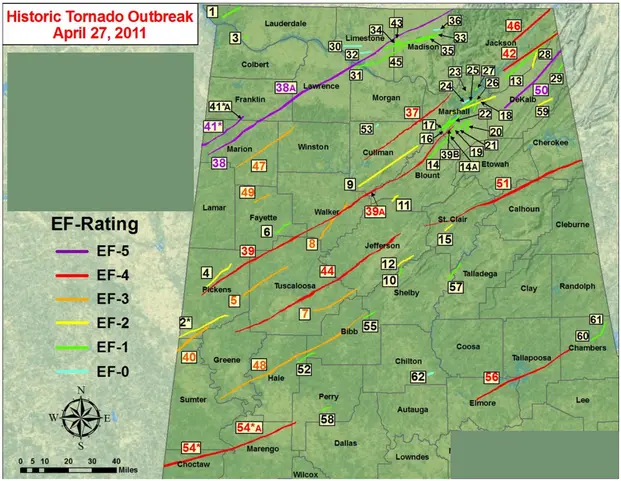
The graph shows the paths of tornados experienced in the state of Alabama on April 27, 2011 based on number and strength with EF-5 representing the strongest.
Select from each drop-down menu the option that creates the most accurate statement, given the information provided.
On the given date, the of the tornados were experienced in the of the state.
ShowHide Answer
Official Answer
Dropdown 1: majority
Dropdown 2: northeast
Kudos
Bookmarks
Official Solution:
Nothing regarding the severity of the tornados can be conclusively determined from the figure as of the three EF-5 tornados shown, one originated in the northwest of the state traveling to the northeast, one originated and terminated in the northeast, and one originated out of state. However, the significant majority of all tornados in the figure originated and terminated in the northeast of the state.
A) fewest
B) majority
C) strongest
D) weakest
Nothing regarding the severity of the tornados can be conclusively determined from the figure as of the three EF-5 tornados shown, one originated in the northwest of the state traveling to the northeast, one originated and terminated in the northeast, and one originated out of state. However, the significant majority of all tornados in the figure originated and terminated in the northeast of the state.
A) north
B) northeast
C) northwest
D) southwest
Correct answer:
Dropdown 1: "majority"
Dropdown 2: "northeast"
bb
Nothing regarding the severity of the tornados can be conclusively determined from the figure as of the three EF-5 tornados shown, one originated in the northwest of the state traveling to the northeast, one originated and terminated in the northeast, and one originated out of state. However, the significant majority of all tornados in the figure originated and terminated in the northeast of the state.
A) fewest
B) majority
C) strongest
D) weakest
Nothing regarding the severity of the tornados can be conclusively determined from the figure as of the three EF-5 tornados shown, one originated in the northwest of the state traveling to the northeast, one originated and terminated in the northeast, and one originated out of state. However, the significant majority of all tornados in the figure originated and terminated in the northeast of the state.
A) north
B) northeast
C) northwest
D) southwest
Correct answer:
Dropdown 1: "majority"
Dropdown 2: "northeast"