Events & Promotions
|
|

GMAT Club Daily Prep
Thank you for using the timer - this advanced tool can estimate your performance and suggest more practice questions. We have subscribed you to Daily Prep Questions via email.
Customized
for You
Track
Your Progress
Practice
Pays
Not interested in getting valuable practice questions and articles delivered to your email? No problem, unsubscribe here.
 Jun 08
08:00 PM EDT
-10:00 PM EDT
Master the GMAT with expert live instruction, a personalized study plan, and real-time support. Includes 40 hours of online classes plus 6 months of access to the TTP GMAT OnDemand video course. Mon/Wed June 8, 2026 →August 12, 2026 8:00pm-10:00pm EST Jun 10
06:00 AM PDT
-06:15 PM PDT
Register for the GMAT Club Virtual MBA Spotlight Fair – the world’s premier event for serious MBA candidates. This is your chance to hear directly from Admissions Directors at nearly every Top 30 MBA program..- Jun 10
10:00 AM PDT
-11:00 AM PDT
Scoring 715 on the GMAT Focus Edition requires more than just learning formulas, memorizing concepts, or solving hundreds of questions. In this episode, Nishant shares how he improved his GMAT preparation by focusing on application of concepts, and more.  Jun 11
11:00 AM EDT
-01:00 PM EDT
TTP GMAT OnDemand gives serious students 400+ hours of expert video instruction, the full TTP course, AI support, weekly office hours, and a 715+ score guarantee—all built for elite GMAT score improvement.


Kudos
Bookmarks
Dropdown 1: Recreational places
Dropdown 2: 55%
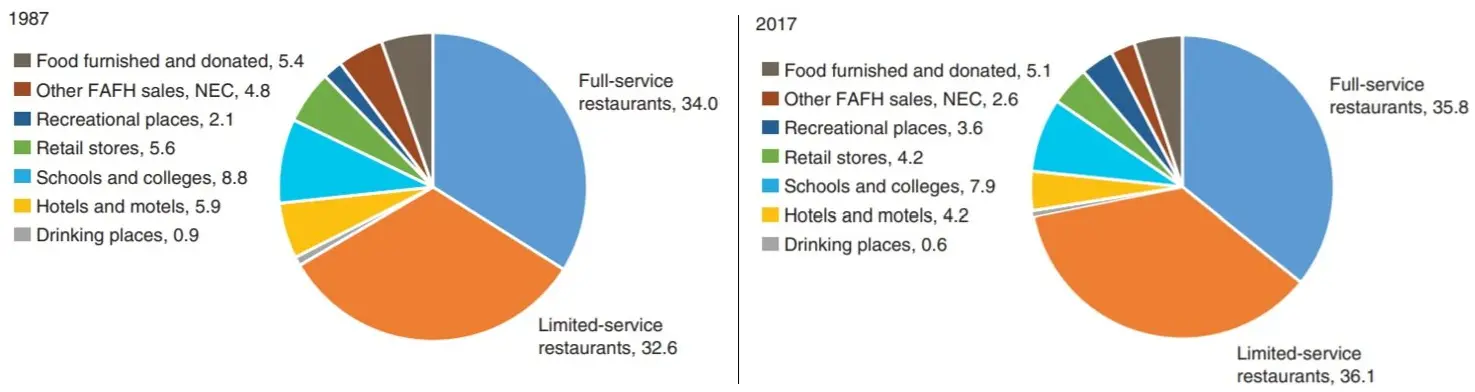
The figure illustrates the percentages of food away from home (FAFH) expenditures by outlet type in 1987 and 2017. The acronym NEC stands for "not elsewhere classified." All estimates include both sales taxes and tips.
Select from each drop-down menu the option that creates the most accurate statement, given the information provided.
If FAFH expenditures did not decrease from 1987 to 2017, the category with the greatest percentage increase in expenditures over the 30-year period is .
If expenditures classified into the "Other FAFH sales, NEC" category in 2017 were equally distributed among the other eight categories, the category with the highest percentage increase in share would see an increase of approximately .
ShowHide Answer
Official Answer
Dropdown 1: Recreational places
Dropdown 2: 55%
Kudos
Bookmarks
Official Solution:
Drop-down 1:
We should focus on the category with the largest increase in share. Recreational Places experienced the greatest increase, with its share rising from 2.1% to 3.6%, representing a 1.7-fold increase. This means the actual increase in expenditures for this category would be 1.7 * (the increase in total expenditures). For instance, if total expenditures doubled, expenditures for Recreational Places would increase by 1.7 * 2 = 3.4 times.
Drop-down 2:
In 2017, "Other FAFH sales, NEC" accounted for 2.6% of the total expenditure. Distributing this share evenly among the other eight categories would add approximately \(\frac{2.6}{8} \approx 0.33\) percentage points to each. The category with the highest percentage increase in share would be the one with the smallest initial share, which is Drinking Places, with an initial share of 0.6%. The percentage increase in share, therefore, would be \(\frac{0.33}{0.6} * 100 = 55\%\).
Correct answer:
Dropdown 1: "Recreational places"
Dropdown 2: "55%"
Bunuel
Drop-down 1:
We should focus on the category with the largest increase in share. Recreational Places experienced the greatest increase, with its share rising from 2.1% to 3.6%, representing a 1.7-fold increase. This means the actual increase in expenditures for this category would be 1.7 * (the increase in total expenditures). For instance, if total expenditures doubled, expenditures for Recreational Places would increase by 1.7 * 2 = 3.4 times.
Drop-down 2:
In 2017, "Other FAFH sales, NEC" accounted for 2.6% of the total expenditure. Distributing this share evenly among the other eight categories would add approximately \(\frac{2.6}{8} \approx 0.33\) percentage points to each. The category with the highest percentage increase in share would be the one with the smallest initial share, which is Drinking Places, with an initial share of 0.6%. The percentage increase in share, therefore, would be \(\frac{0.33}{0.6} * 100 = 55\%\).
Correct answer:
Dropdown 1: "Recreational places"
Dropdown 2: "55%"
Kudos
Bookmarks
I have revised the question, solution, and formatting by adding more details to enhance clarity.