Events & Promotions
|
|

GMAT Club Daily Prep
Thank you for using the timer - this advanced tool can estimate your performance and suggest more practice questions. We have subscribed you to Daily Prep Questions via email.
Customized
for You
Track
Your Progress
Practice
Pays
Not interested in getting valuable practice questions and articles delivered to your email? No problem, unsubscribe here.
 May 03
12:30 AM EDT
-01:30 AM EDT
Learn how Kamakshi achieved a GMAT 675 with an impressive 96th %ile in Data Insights. Discover the unique methods and exam strategies that helped her excel in DI along with other sections for a balanced and high score. May 03
01:30 AM EDT
-02:30 AM EDT
Struggling to find the right strategies to score a 99 %ile on GMAT Focus? Riya (GMAT 715) boosted her score by 100-points in just 15 days! Discover how the right mentorship, tailored strategies, and an unwavering mindset can transform your GMAT prep. May 03
06:30 AM PDT
-08:30 AM PDT
Verbal trouble on GMAT? Fix it NOW! Join Sunita Singhvi for a focused webinar on actionable strategies to boost your Verbal score and take your performance to the next level. May 05
10:00 AM PDT
-11:00 AM PDT
GMAT Inequalities is a high-frequency topic in GMAT Quant, but many students struggle because the concepts behave differently from standard algebra. Understanding the right rules, patterns, and edge cases can significantly improve both speed and accuracy. May 06
12:30 AM EDT
-01:30 AM EDT
GMAT 615 to 715 in Just 15 Days! Riya’s 100-pt Improvement Strategy- May 06
08:30 AM PDT
-09:30 AM PDT
In Episode 3 of our GMAT Ninja Critical Reasoning series, we tackle Discrepancy, Paradox, and Explain an Oddity questions. You know the feeling: the passage gives you two facts that seem completely contradictory.... - May 08
08:00 AM PDT
-08:30 AM PDT
Join the special YouTube live-stream for selecting the winners of GMAT Club MBA Scholarships sponsored by Juno live. Watch who gets these coveted MBA scholarships offered by GMAT Club and Juno.

Kudos
Bookmarks

Dropdown 1: telephone
Dropdown 2: telephone and email
Be sure to select an answer first to save it in the Error Log before revealing the correct answer (OA)!
Difficulty:
 95%
(hard)
95%
(hard)
Question Stats:
40% (02:57) correct 60%
(03:05)
wrong
based on 1916
sessions
60%
(03:05)
wrong
based on 1916
sessions
History
Date
Time
Result
Not Attempted Yet
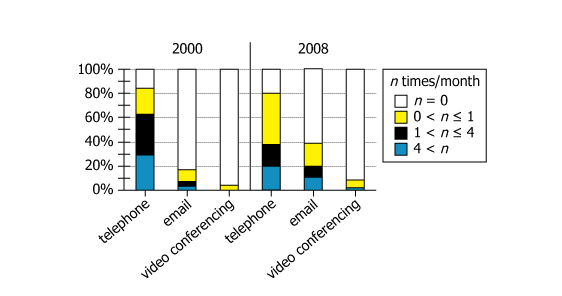
The graph shows data for physicians who, in 2000 and 2008, were surveyed about the average number of times per month they used each of 3 methods (telephone, email, and video conferencing) to communicate with their patients. The bars represent the percentage of the respondents who reported using the indicated method the indicated number of times per month.
Select from each drop-down menu the option that completes the statement so that it most accurately reflects the information provided.
It must be the case that the median number of times per month respondents reported having communicated with patients by in the 2008 survey was less than that in the 2000 survey.
It must be the case that the percentage of respondents who reported having communicated with patients by both was as great or greater in the 2008 survey as it was in the 2000 survey.

GMAT-Club-Forum-xbpkwaue.png [ 13.98 KiB | Viewed 9499 times ]
700210
The graph shows data for physicians who, in 2000 and 2008, were surveyed about the average number of times per month they used each of 3 methods (telephone, email, and video conferencing) to communicate with their patients. The bars represent the percentage of the respondents who reported using the indicated method the indicated number of times per month.
Select from each drop-down menu the option that completes the statement so that it most accurately reflects the information provided.
It must be the case that the median number of times per month respondents reported having communicated with patients by in the 2008 survey was less than that in the 2000 survey.
It must be the case that the percentage of respondents who reported having communicated with patients by both was as great or greater in the 2008 survey as it was in the 2000 survey.
Attachment:
GMAT-Club-Forum-xbpkwaue.png [ 13.98 KiB | Viewed 9499 times ]
ShowHide Answer
Official Answer
Dropdown 1: telephone
Dropdown 2: telephone and email


chetan2u
The tricky part of this question is the data given to us. Once we understand it, the questions are fairly simple.
Say 10 physicians were surveyed.
2000 survey would look something like this
Question: How many times in a month did you communicate with patients using telephone?
Response of the 10 physicians: 0, 0, 1, 1, 2 , 4, 4, 5, 7, 9
20% people said 0, 20% said 1, 30% said more than 1 but less than or equal to 4 and 30% said more than 4.
Same was repeated for email, video and then again in 2008 too.
It must be the case that the median number of times per month respondents reported having communicated with patients by _____ in the 2008 survey was less than that in the 2000 survey.
For which of telephone/email/video was the median for 2008 less than the median for 2000?
The median for telephone in 2000 is 2 or 3 or 4. Black region is where 50% is.
The median for telephone in 2008 is 1. The 50% corresponds to the yellow region.
Hence the median is lower for telephone (ANSWER). For both email and video, median is the same in both years i.e. 0.
It must be the case that the percentage of respondents who reported having communicated with patients by both ______ was as great or greater in the 2008 survey as it was in the 2000 survey.
So we are looking for the overlap of two sets. We need this overlap to be higher or same in 2008 than in 2000.
In 2008, 80% physicians communicated via telephone with their patients. (all regions except white)
In 2008, 40% physicians communicated via email with their patients. (all regions except white)
Hence there must be an overlap of at least 20% here. 20% physicians must have communicated via both. Think Sets.
In 2000, 83% physicians communicated via telephone with their patients. (all regions except white)
In 2008, 18% physicians communicated via email with their patients. (all regions except white)
Is it even possible that 20% communicated via both? No. At the most only 18% could have communicated via both.
Hence answer is telephone and email. ANSWER
Maxsparrow
Was it hard to arrive at this? Not at all. Notice the graph. The "communication regions" (yellow, black and blue in which the physician communicated at least once with the patients) for email are much higher in 2008 and the overlap is necessitated with telephone only because its communication region is very high. So you can straight away jump to "telephone and email" and evaluate that to know if it is the answer.
Check out the discussion on another graph here:
https://youtu.be/ilMxPjHNeic
Attachment:
GMAT-Club-Forum-plaj4ib6.png [ 13.98 KiB | Viewed 10818 times ]


Kudos
Bookmarks
Solution for statement 2 added:
The statement is
It must be the case that the percentage of respondents who reported having communicated with patients by both A and B was as great or greater in the 2008 survey as it was in the 2000 survey.
We can see that we know the % individually but not combined. So, we have to find a pair whose combined % in 2008 would always be greater than that in 2000. For this, you will have to compare worst case scenario of 2008 with best scenario of 2000.
Worst scenario: Minimum overlap between A and B
Best scenario: Maximum overlap between A and B
Let us take telephone and email
Best scenario: Maximum overlap between the two in 2000. So, take all connected through email were connected through telephone, that is complete overlap. Answer: entire 19% of email.
Worst scenario: Minimum overlap between the two in 2008. tele - 80% and email - 40%. So, take all connected through email fill up % not connected through tele, so 100-80 or 20% is filled up. But remaining 40-20 or 20% have to overlap with tele. Answer: 20% of email.
Thus, worst in 2008 is better than best in 2000. Hence, 'Telephone and email' is the answer