Events & Promotions
|
|

GMAT Club Daily Prep
Thank you for using the timer - this advanced tool can estimate your performance and suggest more practice questions. We have subscribed you to Daily Prep Questions via email.
Customized
for You
Track
Your Progress
Practice
Pays
Not interested in getting valuable practice questions and articles delivered to your email? No problem, unsubscribe here.
 May 03
12:30 AM EDT
-01:30 AM EDT
Learn how Kamakshi achieved a GMAT 675 with an impressive 96th %ile in Data Insights. Discover the unique methods and exam strategies that helped her excel in DI along with other sections for a balanced and high score. May 03
01:30 AM EDT
-02:30 AM EDT
Struggling to find the right strategies to score a 99 %ile on GMAT Focus? Riya (GMAT 715) boosted her score by 100-points in just 15 days! Discover how the right mentorship, tailored strategies, and an unwavering mindset can transform your GMAT prep. May 03
06:30 AM PDT
-08:30 AM PDT
Verbal trouble on GMAT? Fix it NOW! Join Sunita Singhvi for a focused webinar on actionable strategies to boost your Verbal score and take your performance to the next level. May 05
10:00 AM PDT
-11:00 AM PDT
GMAT Inequalities is a high-frequency topic in GMAT Quant, but many students struggle because the concepts behave differently from standard algebra. Understanding the right rules, patterns, and edge cases can significantly improve both speed and accuracy. May 06
12:30 AM EDT
-01:30 AM EDT
GMAT 615 to 715 in Just 15 Days! Riya’s 100-pt Improvement Strategy- May 06
08:30 AM PDT
-09:30 AM PDT
In Episode 3 of our GMAT Ninja Critical Reasoning series, we tackle Discrepancy, Paradox, and Explain an Oddity questions. You know the feeling: the passage gives you two facts that seem completely contradictory.... - May 08
08:00 AM PDT
-08:30 AM PDT
Join the special YouTube live-stream for selecting the winners of GMAT Club MBA Scholarships sponsored by Juno live. Watch who gets these coveted MBA scholarships offered by GMAT Club and Juno.

Kudos
Bookmarks

Mean of the total number of attempts to complete for all testers who completed the level: Could be greater than
Median of the total number of attempts to complete for all testers who completed the level: Must be 20 or less
Range of the total number of attempts to complete for all testers who completed the level: Could be greater than
Be sure to select an answer first to save it in the Error Log before revealing the correct answer (OA)!
Difficulty:
 95%
(hard)
95%
(hard)
Question Stats:
34% (03:24) correct 66%
(03:24)
wrong
based on 2398
sessions
66%
(03:24)
wrong
based on 2398
sessions
History
Date
Time
Result
Not Attempted Yet
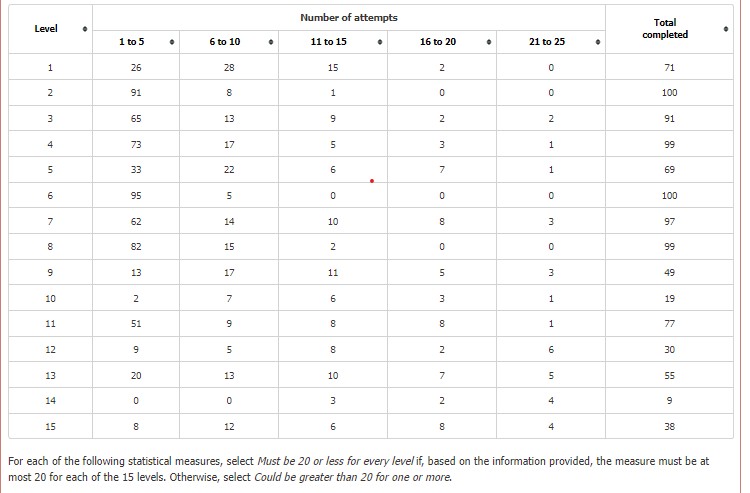
The designers of a video game hired 100 game testers to play the game to determine whether the level of difficulty was appropriate. Each of the 100 testers made at most 25 attempts to complete each of the game's 15 levels (Levels 1–15). When a tester completed a level, he or she then made no further attempts at that level. For each of the levels, the table shows, among the testers who completed the level, the total number of testers whose number of attempts to complete that level fell in various ranges.
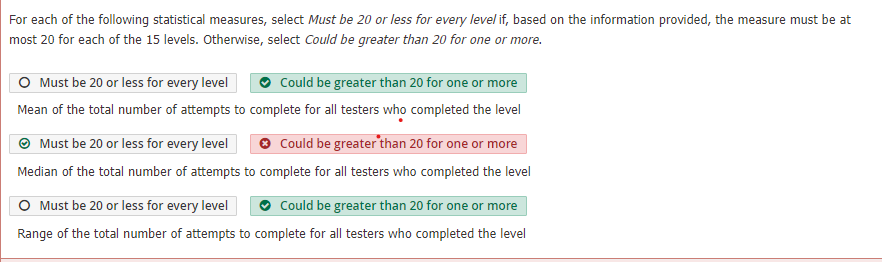
For each of the following statistical measures, select Must be 20 or less for every level if, based on the information provided, the measure must be at most 20 for each of the 15 levels. Otherwise, select Could be greater than 20 for one or more.
| Number of attempts | ||||||
| Level | 1 to 5 | 6 to 10 | 11 to 15 | 16 to 20 | 21 to 25 | Total completed |
|---|---|---|---|---|---|---|
| 1 | 26 | 28 | 15 | 2 | 0 | 71 |
| 2 | 91 | 8 | 1 | 0 | 0 | 100 |
| 3 | 65 | 13 | 9 | 2 | 2 | 91 |
| 4 | 73 | 17 | 5 | 3 | 1 | 99 |
| 5 | 33 | 22 | 6 | 7 | 1 | 69 |
| 6 | 95 | 5 | 0 | 0 | 0 | 100 |
| 7 | 62 | 14 | 10 | 8 | 3 | 97 |
| 8 | 82 | 15 | 2 | 0 | 0 | 99 |
| 9 | 13 | 17 | 11 | 5 | 3 | 49 |
| 10 | 2 | 7 | 6 | 3 | 1 | 19 |
| 11 | 51 | 9 | 8 | 8 | 1 | 77 |
| 12 | 9 | 5 | 8 | 2 | 6 | 30 |
| 13 | 20 | 13 | 10 | 7 | 5 | 55 |
| 14 | 0 | 0 | 3 | 2 | 4 | 9 |
| 15 | 8 | 12 | 6 | 8 | 4 | 38 |
For each of the following statistical measures, select Must be 20 or less for every level if, based on the information provided, the measure must be at most 20 for each of the 15 levels. Otherwise, select Could be greater than 20 for one or more.
ID: 700255
| Must be 20 or less | Could be greater than | |
| Mean of the total number of attempts to complete for all testers who completed the level | ||
| Median of the total number of attempts to complete for all testers who completed the level | ||
| Range of the total number of attempts to complete for all testers who completed the level |
ShowHide Answer
Official Answer
Mean of the total number of attempts to complete for all testers who completed the level: Could be greater than
Median of the total number of attempts to complete for all testers who completed the level: Must be 20 or less
Range of the total number of attempts to complete for all testers who completed the level: Could be greater than
Every tricky question should trigger a follow up quiz.
Build that habit with
GMAT Club Forum Quiz →.


Kudos
Bookmarks
We are looking at details of attempts taken to finish each of the 15 level by 100 of the game testers.
For each of the following statistical measures, select Must be 20 or less for every level if, based on the information provided, the measure must be at most 20 for each of the 15 levels. Otherwise, select Could be greater than 20 for one or more.
So, we have to mainly concentrate on the tab of 20-25 and work on the extreme cases on the higher side.
1. Mean of the total number of attempts to complete for all testers who completed the level.
Check if any of the levels has more number of attempts in 15-20 and 20-25 attempts than the sum of all other columns.
When you scan the table, the level 14 stands out as there are 3 in 11-15 attempts , 2 in 16-20 attempts and 4 in 21-25 attempts.
So, the max mean would be when all the testers took the maximum attempt in each case, so 3 took 15 attempts, 2 took 20 attempts and 4 took 25 attempts.
Mean =\(\frac{ 3*15+2*20+4*25}{3+2+4} = \frac{185}{9} \)= 20.xy >20....Could be greater than 20.
2. Median of the total number of attempts to complete for all testers who completed the level
Check if any of the levels has more number of attempts in 20-25 attempts than the sum of all other columns.
When you scan the table, no level has sum of numbers under 1-5, 6-10, 11-15 and 16-20 attempts less than that under 21-25.
Thus median will always be 20 or less......Equal to or less than 20
3. Range of the total number of attempts to complete for all testers who completed the level
If any level has been finished be some tester in 1-5 attempts while there are some more who have finished it in 20-25 attempts, the maximum range could be 25-1 = 24.
There are many under this case: Level 3, 4, 5, 7, 9-15
Could be greater than 20
darthvader20, check the second case an dsee if that settles your query.


Kudos
Bookmarks
darthvader20
This is what the table tells us: It gives info on each of the 15 levels of the game.
Say take level 10.
2 people cleared it in 1 to 5 attempts,
7 people in 6 to 10 attempts etc.
...
So if I were to write down the number of attempts of everyone who cleared the level 10 in increasing order, it could look something like this:
1, 3, 6, 6, 7, 8, 9, 9, 10, 11 ... etc.
Question 1.
Mean of the total number of attempts to complete for all testers who completed the level
For every level, should the "Mean of the total number of attempts to complete for all testers who completed the level" be upto 20 or can it be more than 20 too?
Sort the table by 21-25 attempts. Very few people lie in the 21-25 range.
Sort the table by "Total Completed". For level 14, 9 total people completed and 4 of them took 21 - 25 attempts. Can the mean be above 20 here?
To maximize the attempts, assume that 3 people took 15 attempts each, 2 people took 20 attempts each and 4 people took 25 attempts each. By the concept of deviation, we see immediately that mean here will be more than 20.
Hence, here the mean CAN be above 20 in a case. It is not necessary that it m ust be 20 or less.
SELECT: Could be greater than
Question 2.
Median of the total number of attempts to complete for all testers who completed the level
The median will be the number of attempts of the middle person.
Sort by "Total Completed"
For level 14, there are 5 people who took 20 or fewer attempts. So the 5th person (middle person) took 20 or fewer attempts only. So the median will be 20 or less.
For all other levels, the middle person is certainly at 20 or fewer attempts because 21-25 have very few people compared with the total number of people who completed the level.
Hence median must be 20 or less for each level. We cannot say what the median will be, we only know it will be 20 or less.
Select: Must be 20 or less
Quetsion 3.
Range of the total number of attempts to complete for all testers who completed the level
The range for all testers could be greater than 20 for most levels. Level 10 has 2 people in 1-5 (say both took 1 attempt each) and 1 in 21 - 25 (say he took 25 attempts). So the range here will be 24, i.e. more than 20.
Hence a range of more than 20 is certainly possible.
SELECT: Could be greater than
Table Analysis discussed here: https://youtu.be/41uPmg6ipos