Last visit was: 19 Nov 2025, 18:10 It is currently 19 Nov 2025, 18:10
Close
GMAT Club Daily Prep
Thank you for using the timer - this advanced tool can estimate your performance and suggest more practice questions. We have subscribed you to Daily Prep Questions via email.

Customized
for You

we will pick new questions that match your level based on your Timer History

Track
Your Progress

every week, we’ll send you an estimated GMAT score based on your performance

Practice
Pays

we will pick new questions that match your level based on your Timer History
Not interested in getting valuable practice questions and articles delivered to your email? No problem, unsubscribe here.
Close
Request Expert Reply
Confirm Cancel
655-705 Level|   Graphs|   Non-Math Related|               
User avatar
suminha
Joined: 03 Feb 2020
Last visit: 02 Jan 2025
Posts: 109
Own Kudos:
462
 [111]
Given Kudos: 242
Location: Korea, Republic of
Posts: 109
Kudos: 462
 [111]
7
Kudos
Add Kudos
103
Bookmarks
Bookmark this Post
Most Helpful Reply
User avatar
chetan2u
User avatar
GMAT Expert
Joined: 02 Aug 2009
Last visit: 15 Nov 2025
Posts: 11,238
Own Kudos:
43,706
 [8]
Given Kudos: 335
Status:Math and DI Expert
Location: India
Concentration: Human Resources, General Management
GMAT Focus 1: 735 Q90 V89 DI81
Products:
Expert
Expert reply
GMAT Focus 1: 735 Q90 V89 DI81
Posts: 11,238
Kudos: 43,706
 [8]
8
Kudos
Add Kudos
Bookmarks
Bookmark this Post
User avatar
Sajjad1994
User avatar
GRE Forum Moderator
Joined: 02 Nov 2016
Last visit: 19 Nov 2025
Posts: 17,304
Own Kudos:
49,313
 [5]
Given Kudos: 6,180
GPA: 3.62
Products:
Posts: 17,304
Kudos: 49,313
 [5]
5
Kudos
Add Kudos
Bookmarks
Bookmark this Post
General Discussion
User avatar
gvij2017
Joined: 09 Aug 2017
Last visit: 18 Jun 2024
Posts: 674
Own Kudos:
Given Kudos: 778
Posts: 674
Kudos: 486
Kudos
Add Kudos
Bookmarks
Bookmark this Post
Please explain how only F & L are likely to change if previews were shown to different audience.
User avatar
krndatta
Joined: 09 Feb 2020
Last visit: 17 Oct 2024
Posts: 383
Own Kudos:
Given Kudos: 433
Location: India
Posts: 383
Kudos: 44
Kudos
Add Kudos
Bookmarks
Bookmark this Post
chetan2u
There will be a negative correlation because the total remains 100.
So if one increases, the other will decrease.
Am I correct in my reasoning?

Thanks
User avatar
Apeksha2101
Joined: 31 May 2018
Last visit: 06 Jun 2025
Posts: 43
Own Kudos:
Given Kudos: 28
Posts: 43
Kudos: 9
Kudos
Add Kudos
Bookmarks
Bookmark this Post
chetan2u

suminha
Attachment:
IR.jpg

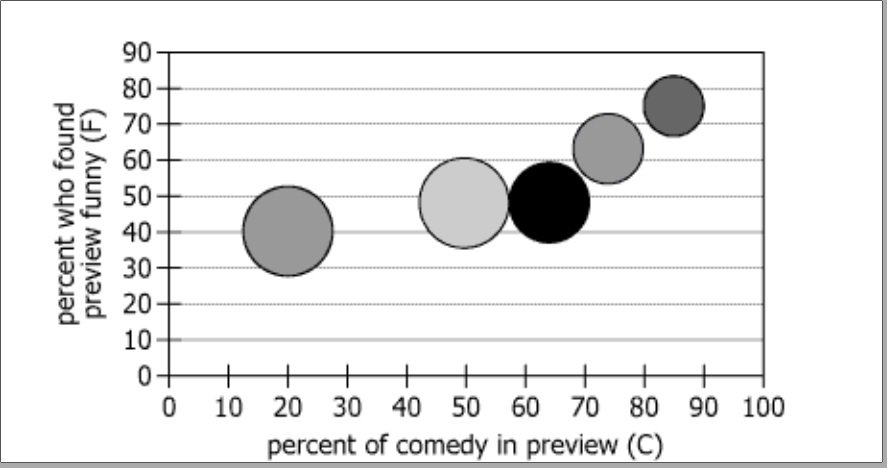
Test audiences screened five 3-minute previews of a certain movie. The movie contains both drama and comedy, but the previews were customized to show differing percentages of comedic and dramatic scenes (measured by screen time). The test audiences were asked, Do you think the preview is funny? and How likely are you to see the movie on the weekend it opens? The position of the center of each bubble indicates the percent of comedy (C) in the previews and the percent of test audience members who found the previews funny (F), and the greater the bubble’s size the greater the average reported likelihood (L) of their seeing the movie on the opening weekend.

Select the option from each drop-down menu that creates the most accurate statement on the basis of the information provided.

1. If the same previews were shown to other test audiences, ____________ could differ from the results shown.

A. only C
B. only C and F
C. C, F, and L
D. only F
E. only F and L
F. only L

 
the percent of comedy in the previews - C
the percent of test audience members who found the previews funny - F, and
likelihood of their seeing the movie on the opening weekend - L.

Now, what is remaining the same ? - the previews, so the content of comedy and drama will remain the same. NO change in C or Drama.
What is changing? - test audiences, so anything related to audiences can change. Thus, change in F and L.

E

Quote:
2. Let D equal the percent of drama in each preview. Assuming each preview is made up entirely of comedy and drama (such that C + D = 100), there is __________ correlation between D and F.

A. a positive
B. a negative
C. no
Since C+D=100, the moment one increases, the other decreases. SO negative correlation.

B
­As you said, it seems like the correlation is between C vs D, but in question it is asked F vs D. How is it negative correlation then.??
User avatar
zlishz
Joined: 29 Nov 2023
Last visit: 21 Jun 2025
Posts: 53
Own Kudos:
Given Kudos: 39
Location: India
GPA: 3.55
Posts: 53
Kudos: 58
Kudos
Add Kudos
Bookmarks
Bookmark this Post
Apeksha2101

chetan2u

suminha
Attachment:
IR.jpg

Test audiences screened five 3-minute previews of a certain movie. The movie contains both drama and comedy, but the previews were customized to show differing percentages of comedic and dramatic scenes (measured by screen time). The test audiences were asked, Do you think the preview is funny? and How likely are you to see the movie on the weekend it opens? The position of the center of each bubble indicates the percent of comedy (C) in the previews and the percent of test audience members who found the previews funny (F), and the greater the bubble’s size the greater the average reported likelihood (L) of their seeing the movie on the opening weekend.

Select the option from each drop-down menu that creates the most accurate statement on the basis of the information provided.

1. If the same previews were shown to other test audiences, ____________ could differ from the results shown.

A. only C
B. only C and F
C. C, F, and L
D. only F
E. only F and L
F. only L


the percent of comedy in the previews - C
the percent of test audience members who found the previews funny - F, and
likelihood of their seeing the movie on the opening weekend - L.

Now, what is remaining the same ? - the previews, so the content of comedy and drama will remain the same. NO change in C or Drama.
What is changing? - test audiences, so anything related to audiences can change. Thus, change in F and L.

E

Quote:
2. Let D equal the percent of drama in each preview. Assuming each preview is made up entirely of comedy and drama (such that C + D = 100), there is __________ correlation between D and F.

A. a positive
B. a negative
C. no
Since C+D=100, the moment one increases, the other decreases. SO negative correlation.

B
­As you said, it seems like the correlation is between C vs D, but in question it is asked F vs D. How is it negative correlation then.??
­In the given graph, C and F are positively correlated. Since C+D=100 (if C increases then D decreases), F and D will also be negatively correlated.
User avatar
av722
Joined: 29 Jul 2024
Last visit: 07 May 2025
Posts: 35
Own Kudos:
Given Kudos: 38
GMAT Focus 1: 555 Q77 V72 DI74
Posts: 35
Kudos: 19
Kudos
Add Kudos
Bookmarks
Bookmark this Post
I missed this too when I answered. The question says if the "same previews" were shown, meaning those previews will have fixed ratios of comedy and drama. You're right that all previous will have different ratios of comedy and drama, but here we have the same preview.
gvij2017
Please explain how only F & L are likely to change if previews were shown to different audience.
User avatar
agrasan
Joined: 18 Jan 2024
Last visit: 19 Nov 2025
Posts: 534
Own Kudos:
Given Kudos: 5,193
Location: India
Products:
Posts: 534
Kudos: 130
Kudos
Add Kudos
Bookmarks
Bookmark this Post
Hi KarishmaB MartyMurray

In question-1, only F and L because due to the language "If the same previews were shown to other test audiences" which means that percent of C and D won't change due to same previews?

Please correct me if I am wrong in my reasoning.
User avatar
KarishmaB
Joined: 16 Oct 2010
Last visit: 19 Nov 2025
Posts: 16,267
Own Kudos:
Given Kudos: 482
Location: Pune, India
Expert
Expert reply
Active GMAT Club Expert! Tag them with @ followed by their username for a faster response.
Posts: 16,267
Kudos: 77,001
Kudos
Add Kudos
Bookmarks
Bookmark this Post
Yes, correct.

agrasan
Hi KarishmaB MartyMurray

In question-1, only F and L because due to the language "If the same previews were shown to other test audiences" which means that percent of C and D won't change due to same previews?

Please correct me if I am wrong in my reasoning.
User avatar
KarishmaB
Joined: 16 Oct 2010
Last visit: 19 Nov 2025
Posts: 16,267
Own Kudos:
77,001
 [1]
Given Kudos: 482
Location: Pune, India
Expert
Expert reply
Active GMAT Club Expert! Tag them with @ followed by their username for a faster response.
Posts: 16,267
Kudos: 77,001
 [1]
1
Kudos
Add Kudos
Bookmarks
Bookmark this Post
suminha


Test audiences screened five 3-minute previews of a certain movie. The movie contains both drama and comedy, but the previews were customized to show differing percentages of comedic and dramatic scenes (measured by screen time). The test audiences were asked, Do you think the preview is funny? and How likely are you to see the movie on the weekend it opens? The position of the center of each bubble indicates the percent of comedy (C) in the previews and the percent of test audience members who found the previews funny (F), and the greater the bubble’s size the greater the average reported likelihood (L) of their seeing the movie on the opening weekend.

Select the option from each drop-down menu that creates the most accurate statement on the basis of the information provided.

If the same previews were shown to other test audiences, could differ from the results shown.

Let D equal the percent of drama in each preview. Assuming each preview is made up entirely of comedy and drama (such that C + D = 100), there is correlation between D and F.­

ID: 100311

Attachment:
IR.jpg
­

If the same previews were shown to other test audiences, ____ could differ from the results shown.


The same previews means the ratio of comedy and drama will be the same so percent of comedy C will stay the same. But since we will show to different audience, F, the percent who found it funny could change and L, likelihood of their seeing the movie on the opening weekend could also change. Note that F and L are audience input and with different audience, they are likely to change.

Select Only F and L


Let D equal the percent of drama in each preview. Assuming each preview is made up entirely of comedy and drama (such that C + D = 100), there is ______ correlation between D and F.­

The sum of comedy and drama is static. When comedy percentage increases as we go to the right on x axis, the drama component reduces. But as we are going to right on x axis, F is increasing as a general trend. Hence as drama reduces, F increases. So D and F have a negative correlation.

Select a negative

Here is a discussion on Graphs: https://youtu.be/ilMxPjHNeic
User avatar
agrasan
Joined: 18 Jan 2024
Last visit: 19 Nov 2025
Posts: 534
Own Kudos:
Given Kudos: 5,193
Location: India
Products:
Posts: 534
Kudos: 130
Kudos
Add Kudos
Bookmarks
Bookmark this Post
Thanks KarishmaB

To learn more from this question, if we had no "could" present in part-1 of the question, then would the possible answer have been "Can't be determined" because we can't say with certainty that different audiences will have different F and L. Please correct me if I am wrong.

KarishmaB
suminha


Test audiences screened five 3-minute previews of a certain movie. The movie contains both drama and comedy, but the previews were customized to show differing percentages of comedic and dramatic scenes (measured by screen time). The test audiences were asked, Do you think the preview is funny? and How likely are you to see the movie on the weekend it opens? The position of the center of each bubble indicates the percent of comedy (C) in the previews and the percent of test audience members who found the previews funny (F), and the greater the bubble’s size the greater the average reported likelihood (L) of their seeing the movie on the opening weekend.

Select the option from each drop-down menu that creates the most accurate statement on the basis of the information provided.

If the same previews were shown to other test audiences, could differ from the results shown.

Let D equal the percent of drama in each preview. Assuming each preview is made up entirely of comedy and drama (such that C + D = 100), there is correlation between D and F.­

ID: 100311

Attachment:
IR.jpg
­

If the same previews were shown to other test audiences, ____ could differ from the results shown.


The same previews means the ratio of comedy and drama will be the same so percent of comedy C will stay the same. But since we will show to different audience, F, the percent who found it funny could change and L, likelihood of their seeing the movie on the opening weekend could also change. Note that F and L are audience input and with different audience, they are likely to change.

Select Only F and L


Let D equal the percent of drama in each preview. Assuming each preview is made up entirely of comedy and drama (such that C + D = 100), there is ______ correlation between D and F.­

The sum of comedy and drama is static. When comedy percentage increases as we go to the right on x axis, the drama component reduces. But as we are going to right on x axis, F is increasing as a general trend. Hence as drama reduces, F increases. So D and F have a negative correlation.

Select a negative

Here is a discussion on Graphs: https://youtu.be/ilMxPjHNeic
User avatar
cheshire
User avatar
DI Forum Moderator
Joined: 26 Jun 2025
Last visit: 18 Sep 2025
Posts: 270
Own Kudos:
Given Kudos: 34
Posts: 270
Kudos: 256
Kudos
Add Kudos
Bookmarks
Bookmark this Post
Yep, the reason the question uses “could differ” is that we know for sure that C (the percent comedy in each preview) is fixed by how the previews are cut, but we cannot be certain that a new audience’s F (funny-rate) or L (likelihood to see) will actually shift.

agrasan
Thanks KarishmaB

To learn more from this question, if we had no "could" present in part-1 of the question, then would the possible answer have been "Can't be determined" because we can't say with certainty that different audiences will have different F and L. Please correct me if I am wrong.

KarishmaB
suminha


Test audiences screened five 3-minute previews of a certain movie. The movie contains both drama and comedy, but the previews were customized to show differing percentages of comedic and dramatic scenes (measured by screen time). The test audiences were asked, Do you think the preview is funny? and How likely are you to see the movie on the weekend it opens? The position of the center of each bubble indicates the percent of comedy (C) in the previews and the percent of test audience members who found the previews funny (F), and the greater the bubble’s size the greater the average reported likelihood (L) of their seeing the movie on the opening weekend.

Select the option from each drop-down menu that creates the most accurate statement on the basis of the information provided.

If the same previews were shown to other test audiences, could differ from the results shown.

Let D equal the percent of drama in each preview. Assuming each preview is made up entirely of comedy and drama (such that C + D = 100), there is correlation between D and F.­

ID: 100311

Attachment:
IR.jpg
­

If the same previews were shown to other test audiences, ____ could differ from the results shown.


The same previews means the ratio of comedy and drama will be the same so percent of comedy C will stay the same. But since we will show to different audience, F, the percent who found it funny could change and L, likelihood of their seeing the movie on the opening weekend could also change. Note that F and L are audience input and with different audience, they are likely to change.

Select Only F and L


Let D equal the percent of drama in each preview. Assuming each preview is made up entirely of comedy and drama (such that C + D = 100), there is ______ correlation between D and F.­

The sum of comedy and drama is static. When comedy percentage increases as we go to the right on x axis, the drama component reduces. But as we are going to right on x axis, F is increasing as a general trend. Hence as drama reduces, F increases. So D and F have a negative correlation.

Select a negative

Here is a discussion on Graphs: https://youtu.be/ilMxPjHNeic
User avatar
egmat
User avatar
e-GMAT Representative
Joined: 02 Nov 2011
Last visit: 19 Nov 2025
Posts: 5,108
Own Kudos:
Given Kudos: 700
GMAT Date: 08-19-2020
Expert
Expert reply
Active GMAT Club Expert! Tag them with @ followed by their username for a faster response.
Posts: 5,108
Kudos: 32,887
Kudos
Add Kudos
Bookmarks
Bookmark this Post
This is a bubble chart analysis question - these multi-variable data interpretation problems can be tricky because you need to track what changes versus what stays fixed.

Let me walk you through the logical approach here.

Understanding What Each Variable Represents:

First, let's identify what we're dealing with:
- C = percent comedy in each preview (determined by the preview's content)
- F = percent of audience who found it funny (depends on audience reaction)
- L = likelihood to see the movie (shown by bubble size, also audience-dependent)

Question 1: What Could Differ with Different Audiences?

Here's the key insight you need to see: if we show the same previews to different test audiences, what's fixed versus what could change?

Think about it this way - the previews themselves don't change. So the percent of comedy in each preview (C) stays exactly the same. But different audiences might have different reactions to the same content.

Therefore:
- C stays the same (preview content is fixed)
- F could change (new audience might find different things funny)
- L could change (new audience might have different likelihood to see the movie)

The answer is only F and L could differ.

Question 2: Correlation Between Drama and "Finding Funny"

Now let's tackle the relationship between D (percent drama) and F (percent finding it funny).

Since the previews are only comedy and drama: \(C + D = 100\)

This means \(D = 100 - C\)

Looking at the chart, notice how as C increases (moving right), F also increases (moving up). This shows a positive relationship between comedy and funny ratings.

But here's what you need to connect: if C and F move in the same direction (both increase together), and D is the opposite of C, then D and F must move in opposite directions.

When D increases, C decreases, which means F decreases too.

Therefore, there is a negative correlation between D and F.

The complete systematic framework for tackling these variable relationship questions - including how to quickly identify fixed vs. variable components and master correlation analysis across different question types - is available in the detailed solution on Neuron. You can also practice with comprehensive explanations for similar official Data Insights questions to build consistency in your approach to these multi-variable analysis problems.
Moderators:
Math Expert
105390 posts
496 posts