Events & Promotions
|
|

GMAT Club Daily Prep
Thank you for using the timer - this advanced tool can estimate your performance and suggest more practice questions. We have subscribed you to Daily Prep Questions via email.
Customized
for You
Track
Your Progress
Practice
Pays
Not interested in getting valuable practice questions and articles delivered to your email? No problem, unsubscribe here.
- Nov 18
11:00 AM PST
-12:00 PM PST
Join us in a live GMAT practice session and solve 30 challenging GMAT questions with other test takers in timed conditions, covering GMAT Quant, Data Sufficiency, Data Insights, Reading Comprehension, and Critical Reasoning questions. - Nov 22
11:00 AM IST
-01:00 PM IST
Do RC/MSR passages scare you? e-GMAT is conducting a masterclass to help you learn – Learn effective reading strategies Tackle difficult RC & MSR with confidence Excel in timed test environment - Nov 23
11:00 AM IST
-01:00 PM IST
Attend this free GMAT Algebra Webinar and learn how to master the most challenging Inequalities and Absolute Value problems with ease. - Nov 25
10:00 AM EST
-11:00 AM EST
Prefer video-based learning? The Target Test Prep OnDemand course is a one-of-a-kind video masterclass featuring 400 hours of lecture-style teaching by Scott Woodbury-Stewart, founder of Target Test Prep and one of the most accomplished GMAT instructors.
Kudos
Bookmarks
Dropdown 1: less than 40%
Dropdown 2: did not gain
Be sure to select an answer first to save it in the Error Log before revealing the correct answer (OA)!
Difficulty:
 95%
(hard)
Question Stats:
13% (03:23) correct 87%
(03:22)
wrong
  based on 92
sessions
History
Date
Time
Result
Not Attempted Yet
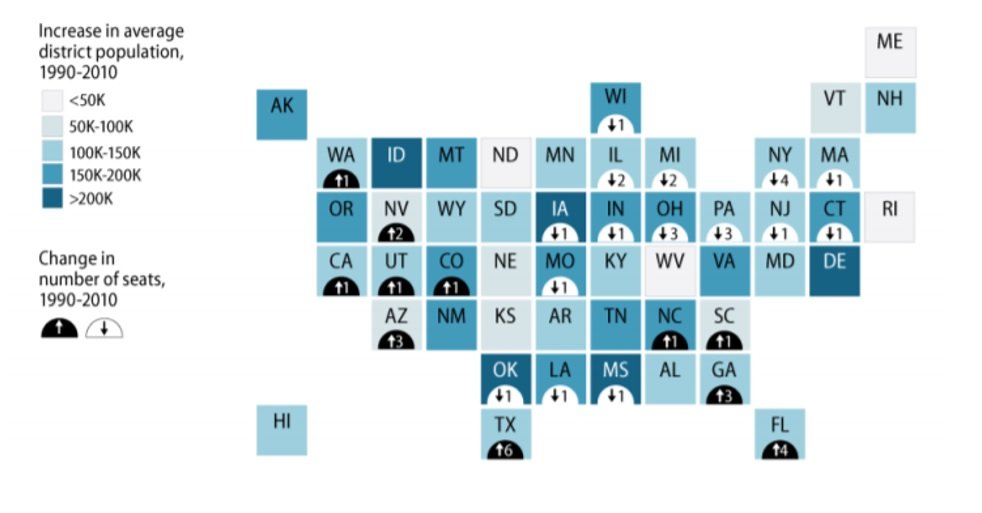
The figure shows changes in state district size and changes in the number of House seats allocated to each state between the 1990 and 2010 apportionments. Twelve U.S. House seats shifted across states following the 2010 census; 10 states lost seats and 8 states gained seats, distributed as shown.

A. If an individual were to select a state from the map at random, the likelihood that the state would have experienced a change in its number of House seats following the 2010 election would be .
B. From the information above, if a state experienced an increase in average district population of more than 200,000 people from 1990-2010, it could be determined that the state House seats over that time period.

345.jpg [ 74.09 KiB | Viewed 3463 times ]
A. If an individual were to select a state from the map at random, the likelihood that the state would have experienced a change in its number of House seats following the 2010 election would be .
B. From the information above, if a state experienced an increase in average district population of more than 200,000 people from 1990-2010, it could be determined that the state House seats over that time period.
Attachment:
345.jpg [ 74.09 KiB | Viewed 3463 times ]
ShowHide Answer
Official Answer
Dropdown 1: less than 40%
Dropdown 2: did not gain
Kudos
Bookmarks
Hi, Sajjad1994, could you please provide the OE?
I am confused with the second question. "if a state experienced an increase in average district population more than 200,000 from 1990 to 2010" from this statement, I found there are more than one state , including ID, IA(-1),OK(-1),MS(-1), DE, falling into this category, and among these states at least 3 states lost House seats. I don't understand why the OE is "did not gain".
I am confused with the second question. "if a state experienced an increase in average district population more than 200,000 from 1990 to 2010" from this statement, I found there are more than one state , including ID, IA(-1),OK(-1),MS(-1), DE, falling into this category, and among these states at least 3 states lost House seats. I don't understand why the OE is "did not gain".
Kudos
Bookmarks
AliciaFeng
Did not gain means stayed the same or lost. So that is correct - 3 of the states lost seats (did not gain) and one did not lose (still did not gain)
Here is the OE:
According to the figure, only ID (Idaho), IA (Iowa), DE (Delaware), MS (Mississippi), and OK (Oklahoma) are shaded with the darkest color blue indicating an average district population increase of > 200,000 people and none of those states gained House seats from 1990-2010, but some had a number of House seats that stayed constant. The correct answer is D


