Events & Promotions
|
|

GMAT Club Daily Prep
Thank you for using the timer - this advanced tool can estimate your performance and suggest more practice questions. We have subscribed you to Daily Prep Questions via email.
Customized
for You
Track
Your Progress
Practice
Pays
Not interested in getting valuable practice questions and articles delivered to your email? No problem, unsubscribe here.
- Nov 20
07:30 AM PST
-08:30 AM PST
Learn what truly sets the UC Riverside MBA apart and how it helps in your professional growth
Kudos
Bookmarks
Dropdown 1: 1995
Dropdown 2: Mike Schmidt
Be sure to select an answer first to save it in the Error Log before revealing the correct answer (OA)!
Difficulty:
 95%
(hard)
Question Stats:
25% (02:00) correct 75%
(02:03)
wrong
  based on 409
sessions
History
Date
Time
Result
Not Attempted Yet
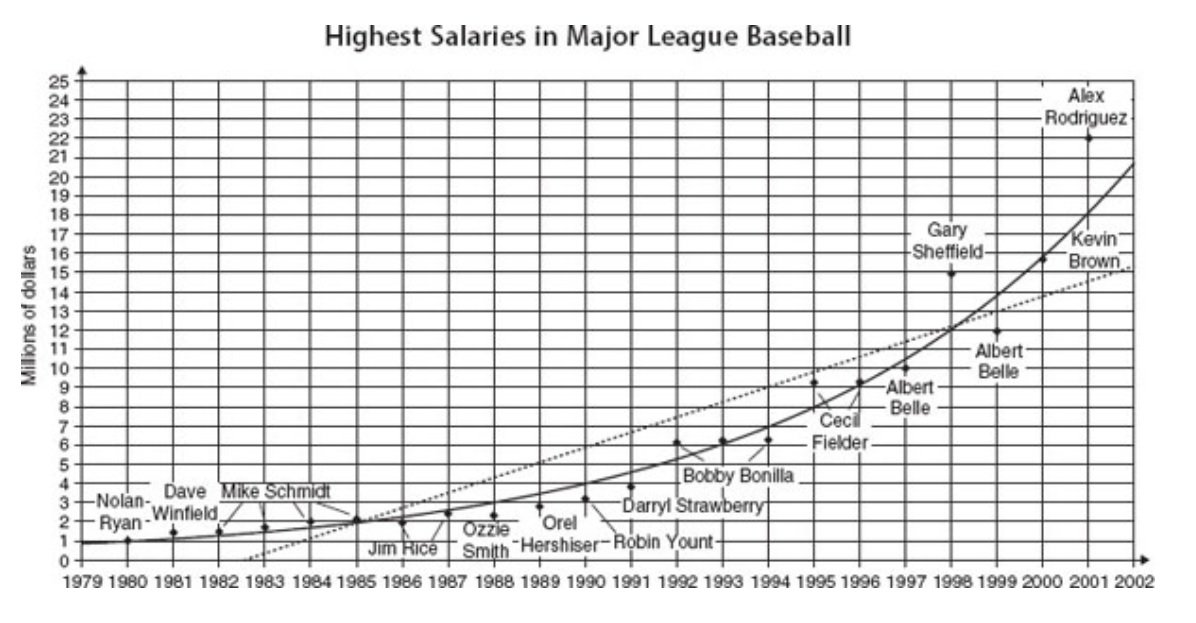
The following graph shows the highest average annual value of contracts for players in Major League Baseball in the years from 1980 to 2001. The solid curve represents a regression equation that is exponential. The dotted line represents the salaries that would be predicted by a linear model.

12.jpg [ 190.42 KiB | Viewed 4551 times ]
1. The rate of growth in the salaries began to increase sharply in approximately .
2. The linear model most successfully predicts the salary for .
Question #2 based on the same graph is available here
Attachment:
12.jpg [ 190.42 KiB | Viewed 4551 times ]
1. The rate of growth in the salaries began to increase sharply in approximately .
2. The linear model most successfully predicts the salary for .
Question #2 based on the same graph is available here
Data Insights (DI) Butler 2023-24 [Question #44, Date: Oct-16-2023] [Click here for Details]
ShowHide Answer
Official Answer
Dropdown 1: 1995
Dropdown 2: Mike Schmidt
Kudos
Bookmarks
i have used eyeballing for 1 question? is there any matchamatical approach to it?


