Events & Promotions
|
|

GMAT Club Daily Prep
Thank you for using the timer - this advanced tool can estimate your performance and suggest more practice questions. We have subscribed you to Daily Prep Questions via email.
Customized
for You
Track
Your Progress
Practice
Pays
Not interested in getting valuable practice questions and articles delivered to your email? No problem, unsubscribe here.
- Nov 19
12:30 PM EST
-01:30 PM EST
Learn how Keshav, a Chartered Accountant, scored an impressive 705 on GMAT in just 30 days with GMATWhiz's expert guidance. In this video, he shares preparation tips and strategies that worked for him, including the mock, time management, and more - Nov 20
07:30 AM PST
-08:30 AM PST
Learn what truly sets the UC Riverside MBA apart and how it helps in your professional growth - Nov 20
01:30 PM EST
-02:30 PM IST
Learn how Kamakshi achieved a GMAT 675 with an impressive 96th %ile in Data Insights. Discover the unique methods and exam strategies that helped her excel in DI along with other sections for a balanced and high score. - Nov 22
11:00 AM IST
-01:00 PM IST
Do RC/MSR passages scare you? e-GMAT is conducting a masterclass to help you learn – Learn effective reading strategies Tackle difficult RC & MSR with confidence Excel in timed test environment - Nov 23
11:00 AM IST
-01:00 PM IST
Attend this free GMAT Algebra Webinar and learn how to master the most challenging Inequalities and Absolute Value problems with ease. - Nov 24
07:00 PM PST
-08:00 PM PST
Full-length FE mock with insightful analytics, weakness diagnosis, and video explanations! - Nov 25
10:00 AM EST
-11:00 AM EST
Prefer video-based learning? The Target Test Prep OnDemand course is a one-of-a-kind video masterclass featuring 400 hours of lecture-style teaching by Scott Woodbury-Stewart, founder of Target Test Prep and one of the most accomplished GMAT instructors.
Kudos
Bookmarks
Dropdown 1: Alex Rodriguez
Dropdown 2: 8
Be sure to select an answer first to save it in the Error Log before revealing the correct answer (OA)!
Difficulty:
 65%
(hard)
Question Stats:
61% (02:25) correct 39%
(02:35)
wrong
  based on 947
sessions
History
Date
Time
Result
Not Attempted Yet
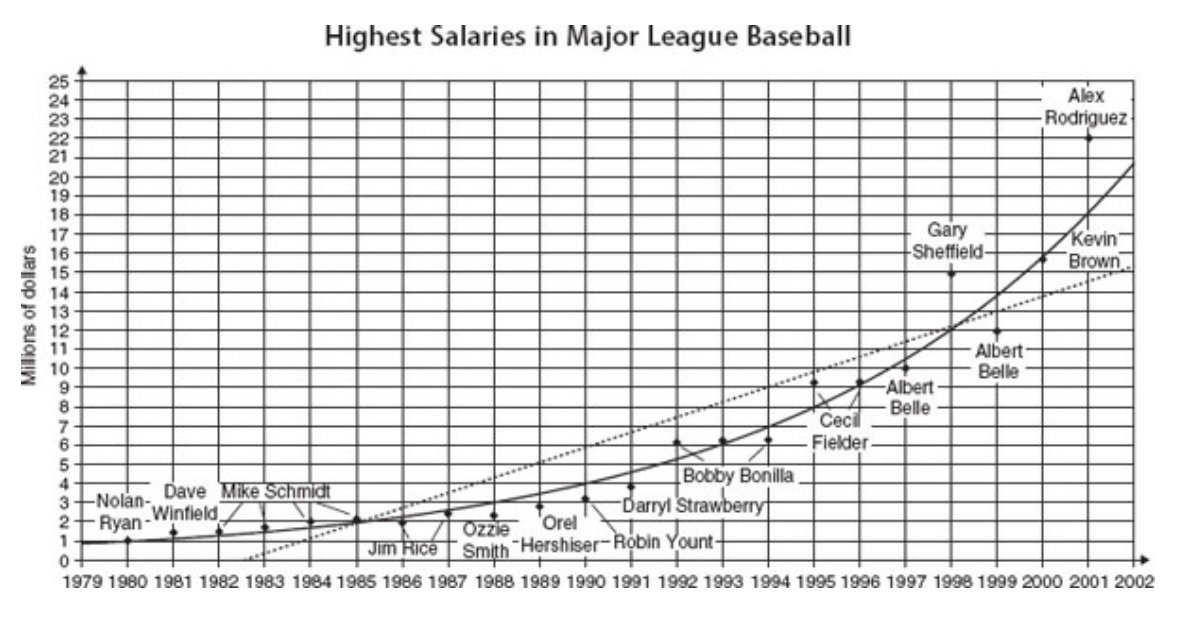
The following graph shows the highest average annual value of contracts for players in Major League Baseball in the years from 1980 to 2001. The solid curve represents a regression equation that is exponential. The dotted line represents the salaries that would be predicted by a linear model.

12.jpg [ 190.42 KiB | Viewed 7523 times ]
1. The possible outlier in this sample is the salary paid to .
2. The linear model would predict salaries higher than those actually negotiated for of the players in this sample.
Question #1 based on the same graph is available here
Attachment:
12.jpg [ 190.42 KiB | Viewed 7523 times ]
1. The possible outlier in this sample is the salary paid to .
2. The linear model would predict salaries higher than those actually negotiated for of the players in this sample.
Show SpoilerAdditional Question
Based upon the linear model, a salary comparable to that paid to Alex Rodriguez in 2001 would be expected in approximately ____________.
(A) 2002
(B) 2005
(C) 2009
(D) 2011
(E) 2020
Answer: D
(A) 2002
(B) 2005
(C) 2009
(D) 2011
(E) 2020
Answer: D
Question #1 based on the same graph is available here
Data Insights (DI) Butler 2023-24 [Question #48, Date: Oct-17-2023] [Click here for Details]
ShowHide Answer
Official Answer
Dropdown 1: Alex Rodriguez
Dropdown 2: 8
Kudos
Bookmarks
pudu
Official Explanation
Based upon the linear model, a salary comparable to that paid to Alex Rodriguez in 2001 would be expected in approximately ____________.
(A) 2002
(B) 2005
(C) 2009
(D) 2011
(E) 2020
Explanation
Use the slope of the dotted line to estimate when it will reach the $22 million territory of Rodriguez’s salary. That will require an increase in salary of about $7 million beyond the last visible point on the line (2002). Based on the slope, it will take approximately 9 years to increase another $7 million, so it will get there around 2011.
Answer: D


