Events & Promotions
|
|

GMAT Club Daily Prep
Thank you for using the timer - this advanced tool can estimate your performance and suggest more practice questions. We have subscribed you to Daily Prep Questions via email.
Customized
for You
Track
Your Progress
Practice
Pays
Not interested in getting valuable practice questions and articles delivered to your email? No problem, unsubscribe here.
- Nov 18
11:00 AM PST
-12:00 PM PST
Join us in a live GMAT practice session and solve 30 challenging GMAT questions with other test takers in timed conditions, covering GMAT Quant, Data Sufficiency, Data Insights, Reading Comprehension, and Critical Reasoning questions. - Nov 22
11:00 AM IST
-01:00 PM IST
Do RC/MSR passages scare you? e-GMAT is conducting a masterclass to help you learn – Learn effective reading strategies Tackle difficult RC & MSR with confidence Excel in timed test environment - Nov 23
11:00 AM IST
-01:00 PM IST
Attend this free GMAT Algebra Webinar and learn how to master the most challenging Inequalities and Absolute Value problems with ease. - Nov 25
10:00 AM EST
-11:00 AM EST
Prefer video-based learning? The Target Test Prep OnDemand course is a one-of-a-kind video masterclass featuring 400 hours of lecture-style teaching by Scott Woodbury-Stewart, founder of Target Test Prep and one of the most accomplished GMAT instructors.
Kudos
Bookmarks
Dropdown 1: 900
Dropdown 2: 3/2
Be sure to select an answer first to save it in the Error Log before revealing the correct answer (OA)!
Difficulty:
 55%
(hard)
Question Stats:
68% (03:09) correct 32%
(03:12)
wrong
  based on 509
sessions
History
Date
Time
Result
Not Attempted Yet
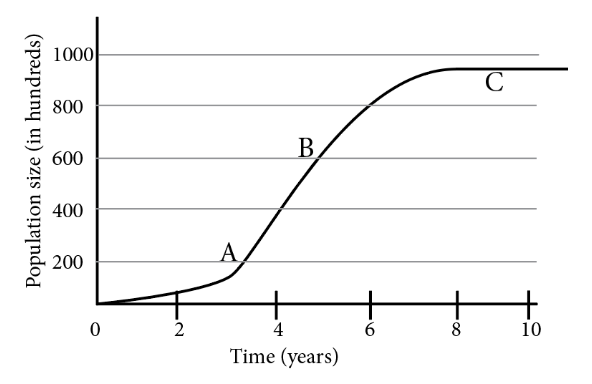
The graph below models the hypothetical population size, in hundreds of individuals, of a local population of Didelphis virginiana for 10 years. Points A, B, and C represent the total population, in hundreds of individuals, at years 3, 5, and 9, respectively, according to the model. The model follows a logistic growth pattern and shows the population as it approaches its carrying capacity, k, of approximately 95,000.

From each dropdown menu, select the option that creates the most accurate statement based on the information provided.
1. For integer values of years from points B to C, the median population size falls at approximately ?
2. Which of the following is closest to the percent increase in population size from year 4 to year 5 as a fraction of the percent increase in population size from year 5 to year 6?

Capture.PNG [ 23 KiB | Viewed 2985 times ]
From each dropdown menu, select the option that creates the most accurate statement based on the information provided.
1. For integer values of years from points B to C, the median population size falls at approximately ?
2. Which of the following is closest to the percent increase in population size from year 4 to year 5 as a fraction of the percent increase in population size from year 5 to year 6?
Attachment:
Capture.PNG [ 23 KiB | Viewed 2985 times ]
ShowHide Answer
Official Answer
Dropdown 1: 900
Dropdown 2: 3/2
poojaarora1818
Joined: 30 Jul 2019
Last visit: 18 Nov 2025
Posts: 1,543
Given Kudos: 3,420
Location: India
Concentration: General Management, Economics
Schools: Duke '26 Haas '26 Kelley '26 Kellogg '26 McDonough '26
GPA: 3
WE:Human Resources (Human Resources)
Kudos
Bookmarks
Bismuth83
Solution:
1. For integer values of years from points B to C, the median population size falls at approximately = 600+999/2=900 approx.
2. Which of the following is closest to the percent increase in population size from year 4 to year 5 as a fraction of the percent increase in population size from year 5 to year 6?
Year 4 to 5 = 600-400/400=1/2
Year 5 to 6 = 800-600/600=1/3
So. the fraction of the population from Years 4 to 5 as a fraction population size from year 5 to year 6 is 3/2
Kudos
Bookmarks
1. The population size from years 5 to 9 is increasing, which means the values are already sorted. The median will the value at year 7 or about 90000.
2. The percent increase from year 4 to 5 is equal to \(\frac{Population \ size \ at \ year \ 5 - Population \ size \ at \ year \ 4}{ Population \ size \ at \ year \ 4} * 100\% = \frac{60000 - 40000}{40000} * 100\% = 50\% = \frac{1}{2}\). The percent increase from year 5 to 6 is equal to \(\frac{Population \ size \ at \ year \ 6 - Population \ size \ at \ year \ 5}{ Population \ size \ at \ year \ 5 } * 100\% = \frac{80000 - 60000}{60000} * 100\% = 33.33\% = \frac{1}{3}\). The ratio between the two will be \(\frac{\frac{1}{2}}{\frac{1}{3}} = \frac{3}{2}\).
2. The percent increase from year 4 to 5 is equal to \(\frac{Population \ size \ at \ year \ 5 - Population \ size \ at \ year \ 4}{ Population \ size \ at \ year \ 4} * 100\% = \frac{60000 - 40000}{40000} * 100\% = 50\% = \frac{1}{2}\). The percent increase from year 5 to 6 is equal to \(\frac{Population \ size \ at \ year \ 6 - Population \ size \ at \ year \ 5}{ Population \ size \ at \ year \ 5 } * 100\% = \frac{80000 - 60000}{60000} * 100\% = 33.33\% = \frac{1}{3}\). The ratio between the two will be \(\frac{\frac{1}{2}}{\frac{1}{3}} = \frac{3}{2}\).


