Events & Promotions
|
|

GMAT Club Daily Prep
Thank you for using the timer - this advanced tool can estimate your performance and suggest more practice questions. We have subscribed you to Daily Prep Questions via email.
Customized
for You
Track
Your Progress
Practice
Pays
Not interested in getting valuable practice questions and articles delivered to your email? No problem, unsubscribe here.
- Nov 20
07:30 AM PST
-08:30 AM PST
Learn what truly sets the UC Riverside MBA apart and how it helps in your professional growth - Nov 22
11:00 AM IST
-01:00 PM IST
Do RC/MSR passages scare you? e-GMAT is conducting a masterclass to help you learn – Learn effective reading strategies Tackle difficult RC & MSR with confidence Excel in timed test environment - Nov 23
11:00 AM IST
-01:00 PM IST
Attend this free GMAT Algebra Webinar and learn how to master the most challenging Inequalities and Absolute Value problems with ease. - Nov 25
10:00 AM EST
-11:00 AM EST
Prefer video-based learning? The Target Test Prep OnDemand course is a one-of-a-kind video masterclass featuring 400 hours of lecture-style teaching by Scott Woodbury-Stewart, founder of Target Test Prep and one of the most accomplished GMAT instructors.
Dropdown 1: July
Dropdown 2: 200,000
Be sure to select an answer first to save it in the Error Log before revealing the correct answer (OA)!
Difficulty:
 45%
(medium)
Question Stats:
61% (02:15) correct 39%
(02:30)
wrong
  based on 2545
sessions
History
Date
Time
Result
Not Attempted Yet
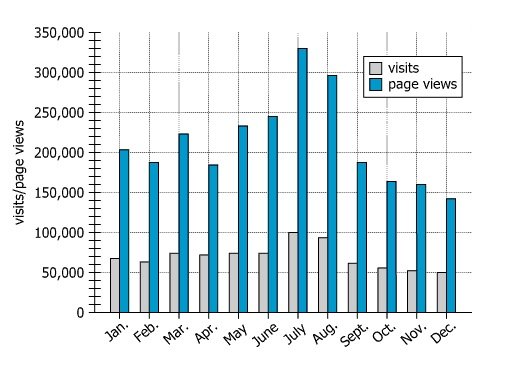
The graph shows the number of visits and the number of page views a certain website received each month last year.
Use the drop-down menus to fill in the blanks in each of the following statements based on the information given by the graph.
The month with the fewest visits per page view was
The median number of monthly page views was closest to
ID: 100346

Tab.jpg [ 54.54 KiB | Viewed 51947 times ]
Attachment:
Tab.jpg [ 54.54 KiB | Viewed 51947 times ]
ShowHide Answer
Official Answer
Dropdown 1: July
Dropdown 2: 200,000
GMATCoachBen
 Expert
Tutor
Joined: 21 Mar 2017
Last visit: 18 Nov 2025
Posts: 465
Given Kudos: 210
Status:Professional GMAT Trainer
Affiliations: GMAT Coach
Location: United States (WA)
GMAT Focus 1: 775 Q87 V90 DI88 (Online) 

GMAT 1: 760 Q50 V44

GMAT 2: 770 Q51 V44

GMAT 3: 770 Q50 V44

GMAT 4: 770 Q50 V45 (Online)

GMAT 5: 780 Q51 V48

Expert reply
Kudos
Bookmarks
Video solution here:
Kudos
Bookmarks
TDK82
Answer 1 : To calculate the month with the fewest visits per page
if we can maximize the denominator while keeping the numerator smallest , we can get the answer.
Visually, if you see July has the maximum gap between the visits and page views. Thus, it should be July.
Answer 2 : To calculate the median number of page visits, we need to find the 6th and 7th page visits if we sort all the page visits in order.
For that, if you see we have Lowest below 150k. Now we have another 5 page visits between 150k and 200k. thus, 6th page visit would be the maximum of the page visits in this range which is around 180k in Feb or sept.
7th would be the next highest in this after the above range maximum, we could see the one at 220k(in march) is the next greater page visit. Thus median will be the mean of 6th and 7th largest page visits. or Median = 180k + 220k/2 = 200k. Thus, answer would be anything near this number.
Please post the original answers.


