Events & Promotions
|
|

GMAT Club Daily Prep
Thank you for using the timer - this advanced tool can estimate your performance and suggest more practice questions. We have subscribed you to Daily Prep Questions via email.
Customized
for You
Track
Your Progress
Practice
Pays
Not interested in getting valuable practice questions and articles delivered to your email? No problem, unsubscribe here.
- Nov 18
11:00 AM PST
-12:00 PM PST
Join us in a live GMAT practice session and solve 30 challenging GMAT questions with other test takers in timed conditions, covering GMAT Quant, Data Sufficiency, Data Insights, Reading Comprehension, and Critical Reasoning questions. - Nov 22
11:00 AM IST
-01:00 PM IST
Do RC/MSR passages scare you? e-GMAT is conducting a masterclass to help you learn – Learn effective reading strategies Tackle difficult RC & MSR with confidence Excel in timed test environment - Nov 23
11:00 AM IST
-01:00 PM IST
Attend this free GMAT Algebra Webinar and learn how to master the most challenging Inequalities and Absolute Value problems with ease. - Nov 25
10:00 AM EST
-11:00 AM EST
Prefer video-based learning? The Target Test Prep OnDemand course is a one-of-a-kind video masterclass featuring 400 hours of lecture-style teaching by Scott Woodbury-Stewart, founder of Target Test Prep and one of the most accomplished GMAT instructors.
Kudos
Bookmarks
Dropdown 1: 2
Dropdown 2: 1
Be sure to select an answer first to save it in the Error Log before revealing the correct answer (OA)!
Difficulty:
 75%
(hard)
Question Stats:
67% (03:10) correct 33%
(02:57)
wrong
  based on 896
sessions
History
Date
Time
Result
Not Attempted Yet
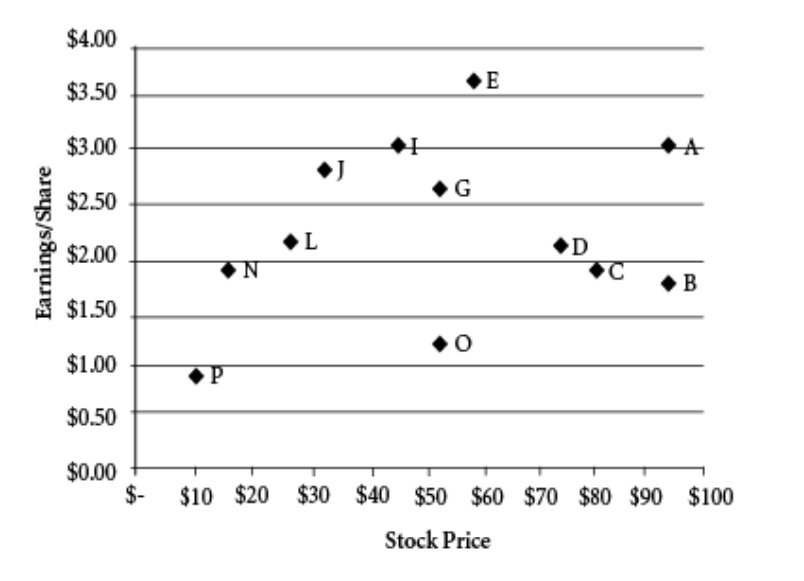
The graph shows the stock price and the earnings per share for a number of companies in the same sector. A company’s price-to-earnings (P/E) ratio is the ratio of the company’s stock price to the company’s earnings per share.

Based on the given information, fill in the blanks in each of the following statements.
Of the companies whose stock price is greater than $60, have a P/E ratio greater than 40.
The number of companies that have a P/E ratio less than 10 is .

12.jpg [ 47.7 KiB | Viewed 8007 times ]
Based on the given information, fill in the blanks in each of the following statements.
Of the companies whose stock price is greater than $60, have a P/E ratio greater than 40.
The number of companies that have a P/E ratio less than 10 is .
Attachment:
12.jpg [ 47.7 KiB | Viewed 8007 times ]
ShowHide Answer
Official Answer
Dropdown 1: 2
Dropdown 2: 1
Kudos
Bookmarks
1. Four companies with stock price over 60$:
A, B, C and D.
A quick check gives us companies B and C that have P/E > 40
Ans. 2
2. Only 1 company (N) seems to have P/E less than 10. (Invest in this, folks )
)
Ans. 1
A, B, C and D.
A quick check gives us companies B and C that have P/E > 40
Ans. 2
2. Only 1 company (N) seems to have P/E less than 10. (Invest in this, folks
Ans. 1
Kudos
Bookmarks
Company N's stock price is less than $20 (~$16) and EPS is less than $2 (~1.8) which is certainly less than $10??


