Last visit was: 18 Nov 2025, 17:39 It is currently 18 Nov 2025, 17:39
Close
GMAT Club Daily Prep
Thank you for using the timer - this advanced tool can estimate your performance and suggest more practice questions. We have subscribed you to Daily Prep Questions via email.

Customized
for You

we will pick new questions that match your level based on your Timer History

Track
Your Progress

every week, we’ll send you an estimated GMAT score based on your performance

Practice
Pays

we will pick new questions that match your level based on your Timer History
Not interested in getting valuable practice questions and articles delivered to your email? No problem, unsubscribe here.
Close
Request Expert Reply
Confirm Cancel
User avatar
Bismuth83
User avatar
DI Forum Moderator
Joined: 15 Sep 2024
Last visit: 01 Aug 2025
Posts: 719
Own Kudos:
2,605
 [4]
Given Kudos: 441
Expert
Expert reply
Posts: 719
Kudos: 2,605
 [4]
2
Kudos
Add Kudos
2
Bookmarks
Bookmark this Post
User avatar
Gmat750aspirant
Joined: 06 Jul 2024
Last visit: 18 Nov 2025
Posts: 277
Own Kudos:
Given Kudos: 39
Location: India
Concentration: Entrepreneurship, General Management
WE:Asset Management (Computer Hardware)
Posts: 277
Kudos: 168
Kudos
Add Kudos
Bookmarks
Bookmark this Post
User avatar
poojaarora1818
Joined: 30 Jul 2019
Last visit: 18 Nov 2025
Posts: 1,543
Own Kudos:
Given Kudos: 3,420
Location: India
Concentration: General Management, Economics
GPA: 3
WE:Human Resources (Human Resources)
Products:
Kudos
Add Kudos
Bookmarks
Bookmark this Post
User avatar
Gmat750aspirant
Joined: 06 Jul 2024
Last visit: 18 Nov 2025
Posts: 277
Own Kudos:
168
 [1]
Given Kudos: 39
Location: India
Concentration: Entrepreneurship, General Management
WE:Asset Management (Computer Hardware)
Posts: 277
Kudos: 168
 [1]
1
Kudos
Add Kudos
Bookmarks
Bookmark this Post
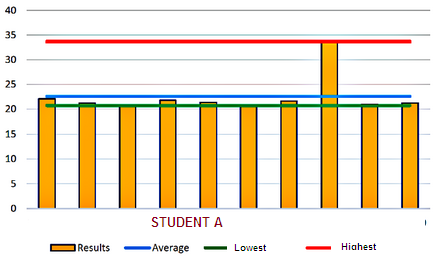
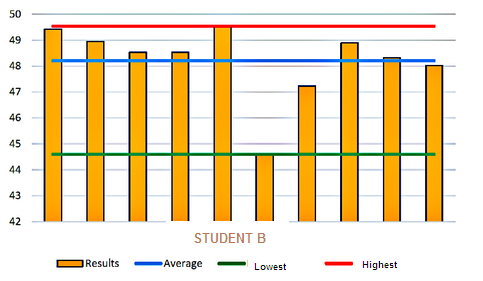
There are 3 bar graph below blue line for Student B
poojaarora1818
I am getting student B for option 1, but for the second part, I am still confused about how it is test 3?
Bismuth83
The two graphs below show the grades obtained by two students A and B in ten tests they took last year. The Red, Blue and Green lines indicate the Highest, Average, and Lowest scores respectively.­


The student whose median score was more than the average score was , and he also scored less than the average score in tests.­

Attachment:
I20-02.png
Attachment:
I20-01.png
User avatar
poojaarora1818
Joined: 30 Jul 2019
Last visit: 18 Nov 2025
Posts: 1,543
Own Kudos:
732
 [1]
Given Kudos: 3,420
Location: India
Concentration: General Management, Economics
GPA: 3
WE:Human Resources (Human Resources)
Products:
1
Kudos
Add Kudos
Bookmarks
Bookmark this Post
Oh Yeah! Thanks for the response. Got it.
Gmat750aspirant
There are 3 bar graph below blue line for Student B
poojaarora1818
I am getting student B for option 1, but for the second part, I am still confused about how it is test 3?
Bismuth83
The two graphs below show the grades obtained by two students A and B in ten tests they took last year. The Red, Blue and Green lines indicate the Highest, Average, and Lowest scores respectively.­


The student whose median score was more than the average score was , and he also scored less than the average score in tests.­

Attachment:
I20-02.png
Attachment:
I20-01.png
User avatar
subhamkmr390
Joined: 25 Feb 2025
Last visit: 27 Jul 2025
Posts: 4
Own Kudos:
Given Kudos: 75
Posts: 4
Kudos: 4
Kudos
Add Kudos
Bookmarks
Bookmark this Post
can someone please explain how to find median fast in such graphs?
User avatar
dev21212121
Joined: 04 Nov 2024
Last visit: 18 Nov 2025
Posts: 10
Given Kudos: 12
Posts: 10
Kudos: 0
Kudos
Add Kudos
Bookmarks
Bookmark this Post
subhamkmr390
can someone please explain how to find median fast in such graphs?
yes i want to know the same coz it is taking a lot of time.
User avatar
lancer4444
Joined: 28 Oct 2024
Last visit: 08 Sep 2025
Posts: 5
Own Kudos:
Given Kudos: 597
Posts: 5
Kudos: 1
Kudos
Add Kudos
Bookmarks
Bookmark this Post
you dont actually want to calculate the median...for 20 inputs you are gonna waste a lot of time and risk a calculation error in my opinion.

The first graphs there is only only one bar that sticks above the blue line. we know that when we order the scores the median (i.e. the average of observation 5 and 6) will be for sure below the value in the blue line.

The second graph we can see only three observation are below that blue line..surely, the median (i.e. the average of observation 5 and 6) will greater than the blue line. Also recognizing this will help us easily answer the second part of the question.
User avatar
lancer4444
Joined: 28 Oct 2024
Last visit: 08 Sep 2025
Posts: 5
Own Kudos:
Given Kudos: 597
Posts: 5
Kudos: 1
Kudos
Add Kudos
Bookmarks
Bookmark this Post
dev21212121
subhamkmr390
can someone please explain how to find median fast in such graphs?
yes i want to know the same coz it is taking a lot of time.
you dont actually want to calculate the median...for 20 inputs you are gonna waste a lot of time and risk a calculation error in my opinion.

The first graphs there is only only one bar that sticks above the blue line. we know that when we order the scores the median (i.e. the average of observation 5 and 6) will be for sure below the value in the blue line.

The second graph we can see only three observation are below that blue line..surely, the median (i.e. the average of observation 5 and 6) will greater than the blue line. Also recognizing this will help us easily answer the second part of the question.
User avatar
subhamkmr390
Joined: 25 Feb 2025
Last visit: 27 Jul 2025
Posts: 4
Own Kudos:
4
 [1]
Given Kudos: 75
Posts: 4
Kudos: 4
 [1]
1
Kudos
Add Kudos
Bookmarks
Bookmark this Post
Makes a lot of sense, thank you!
lancer4444
dev21212121
subhamkmr390
can someone please explain how to find median fast in such graphs?
yes i want to know the same coz it is taking a lot of time.
you dont actually want to calculate the median...for 20 inputs you are gonna waste a lot of time and risk a calculation error in my opinion.

The first graphs there is only only one bar that sticks above the blue line. we know that when we order the scores the median (i.e. the average of observation 5 and 6) will be for sure below the value in the blue line.

The second graph we can see only three observation are below that blue line..surely, the median (i.e. the average of observation 5 and 6) will greater than the blue line. Also recognizing this will help us easily answer the second part of the question.
User avatar
Bunuel
User avatar
Math Expert
Joined: 02 Sep 2009
Last visit: 18 Nov 2025
Posts: 105,355
Own Kudos:
Given Kudos: 99,964
Products:
Expert
Expert reply
Active GMAT Club Expert! Tag them with @ followed by their username for a faster response.
Posts: 105,355
Kudos: 778,073
Kudos
Add Kudos
Bookmarks
Bookmark this Post
Improved version of this question is here: https://gmatclub.com/forum/the-bar-char ... 43889.html