Last visit was: 23 Sep 2026, 03:43 It is currently 23 Sep 2026, 03:43
Close
GMAT Club Daily Prep
Thank you for using the timer - this advanced tool can estimate your performance and suggest more practice questions. We have subscribed you to Daily Prep Questions via email.

Customized
for You

we will pick new questions that match your level based on your Timer History

Track
Your Progress

every week, we’ll send you an estimated GMAT score based on your performance

Practice
Pays

we will pick new questions that match your level based on your Timer History
Not interested in getting valuable practice questions and articles delivered to your email? No problem, unsubscribe here.
Close
Request Expert Reply
Confirm Cancel
555-605 (Medium)|   Graphs|   Non-Math Related|               
User avatar
gmatexam439
User avatar
Moderator
Joined: 28 Mar 2017
Last visit: 18 Oct 2024
Posts: 1,047
Own Kudos:
2,235
 [83]
Given Kudos: 200
Location: India
Concentration: Finance, Technology
GMAT 1: 730 Q49 V41
GPA: 4
Products:
GMAT 1: 730 Q49 V41
Posts: 1,047
Kudos: 2,235
 [83]
10
Kudos
Add Kudos
73
Bookmarks
Bookmark this Post
Most Helpful Reply
avatar
MBAMSAspirant16
Joined: 29 Jan 2015
Last visit: 19 Apr 2021
Posts: 9
Own Kudos:
25
 [18]
Given Kudos: 16
Location: India
Concentration: Technology, International Business
GMAT 1: 630 Q49 V26
GPA: 3.76
GMAT 1: 630 Q49 V26
Posts: 9
Kudos: 25
 [18]
14
Kudos
Add Kudos
4
Bookmarks
Bookmark this Post
User avatar
chetan2u
User avatar
GMAT Expert
Joined: 02 Aug 2009
Last visit: 22 Sep 2026
Posts: 11,319
Own Kudos:
46,251
 [6]
Given Kudos: 340
Status:Math and DI Expert
Location: India
Concentration: Human Resources, General Management
GMAT Focus 1: 735 Q90 V89 DI81
Products:
Expert
Expert reply
Active GMAT Club Expert! Tag them with @ followed by their username for a faster response.
GMAT Focus 1: 735 Q90 V89 DI81
Posts: 11,319
Kudos: 46,251
 [6]
5
Kudos
Add Kudos
1
Bookmarks
Bookmark this Post
General Discussion
User avatar
chetan2u
User avatar
GMAT Expert
Joined: 02 Aug 2009
Last visit: 22 Sep 2026
Posts: 11,319
Own Kudos:
46,251
 [1]
Given Kudos: 340
Status:Math and DI Expert
Location: India
Concentration: Human Resources, General Management
GMAT Focus 1: 735 Q90 V89 DI81
Products:
Expert
Expert reply
Active GMAT Club Expert! Tag them with @ followed by their username for a faster response.
GMAT Focus 1: 735 Q90 V89 DI81
Posts: 11,319
Kudos: 46,251
 [1]
1
Kudos
Add Kudos
Bookmarks
Bookmark this Post
We have lot of points on the horizontal axis while the dropdowns have only 3-4 options, so work on the options directly to save time.

1) The plane was closer to its destination at __1__
The dropdowns tell us that the destination has to be farther even after flying for some extra time. In the graph, it will refer to points when the curve moves up as it moves right.
Look at the three options:
180-200: the curve moves down during the period, so teh destination comes closer.
60-80: the curve moves up during the period, and is our answer.
240-260: the curve, here too, moves down during the period, so the destination comes closer.

2) Of all of the 20-minute intervals beginning and ending at times labeled on the graph, the interval in which the plane traveled farthest toward its destination was the interval from __2__
We have to look at the 20-minute intervals that has the greatest downward slope: We can see that the period 160-200 has the greatest slope, so our answer should generally be within this range.
Look at the three options:
240-260: the curve moves from 20 to 5 approx during the period.
60-80: the curve moves up during the period, and we know the plane moves farther away..
180-200: the curve moves 110 to 65,so moves closest during this period and is our answer

 
User avatar
KarishmaB
Joined: 16 Oct 2010
Last visit: 22 Sep 2026
Posts: 16,657
Own Kudos:
81,486
 [3]
Given Kudos: 492
Location: Pune, India
Expert
Expert reply
Active GMAT Club Expert! Tag them with @ followed by their username for a faster response.
Posts: 16,657
Kudos: 81,486
 [3]
1
Kudos
Add Kudos
1
Bookmarks
Bookmark this Post
 
Anugmat740
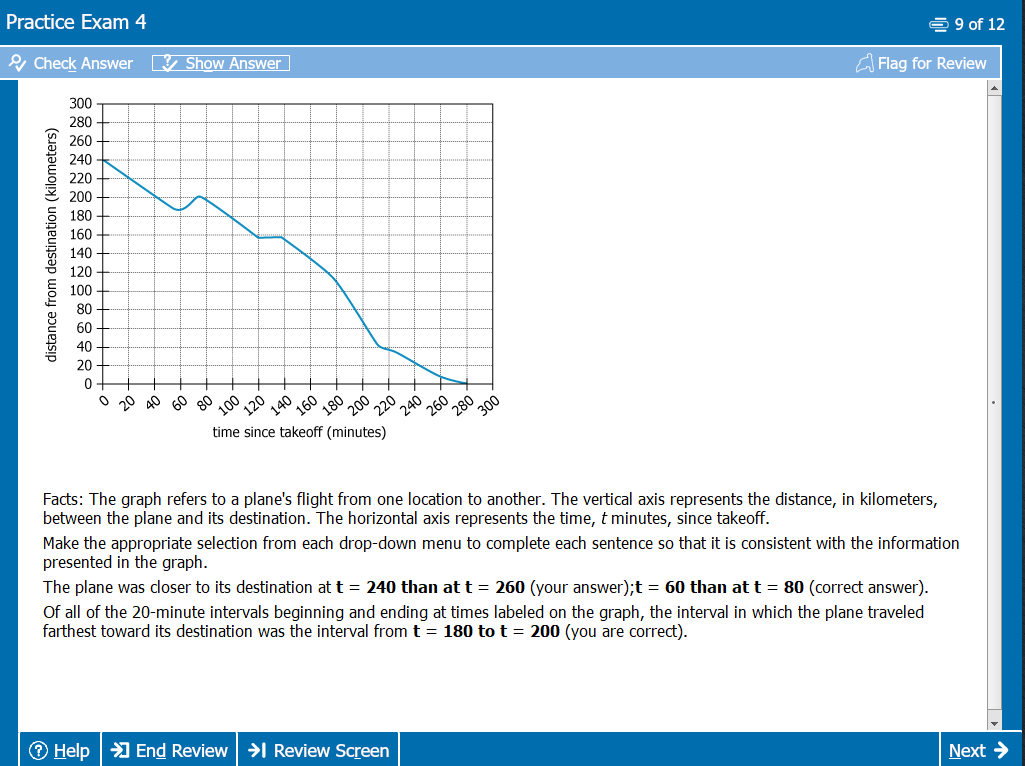
­Facts: The graph refers to a plane's flight from one location to another. The vertical axis represents the distance, in kilometers, between the plane and its destination. The horizontal axis represents the time, t minutes, since takeoff.

Make the appropriate selection from each drop-down menu to complete each sentence so that it is consistent with the information presented in the graph.­


1) The plane was closer to its destination at

2) Of all of the 20-minute intervals beginning and ending at times labeled on the graph, the interval in which the plane traveled farthest toward its destination was the interval from 


Source: GMAT Prep
Attachment:
Aeroplane.png
­
­
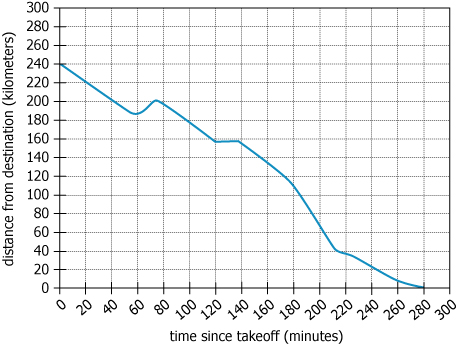
The graph shows distance from destination on Y axis as time progresses on X axis. It starts at 240 km and ends at 0 which makes sense. The place of origin was 240 km away from the destination and time taken for the journey was 280 mins. 

1) The plane was closer to its destination at  __________ 

The graph is falling generally which makes sense since distance from destination will decrease as time passes. But it isn't an all smooth graph. There are some inflections in the graph - what do they show? Between 60 to 80, the graph is rising. At around 60 mins, distance to destination is about 185 km and at 80 mins, distance to destination is about 197 km. So the plane had to loop around perhaps because of bad weather or something.  
Hence the plane was closer to its destination at t = 60 than at t = 80

ANSWER: at t = 60 than at t = 80


2) Of all of the 20-minute intervals beginning and ending at times labeled on the graph, the interval in which the plane traveled farthest toward its destination was the interval from ______

The 20 min intervals labeled on the graph are 0 - 20 min, 20 - 40  mins etc.  The plane travel farthest in that interval in which the plane reduced the 'distance from destination' rapidly i.e. in which the graph fell rapidly. We can see that the slope of the graph is maximum between 180 - 200 mins. 

ANSWER: 180 - 200 mins
User avatar
sayan640
Joined: 29 Oct 2015
Last visit: 18 Sep 2026
Posts: 1,042
Own Kudos:
Given Kudos: 793
GMAT 1: 570 Q42 V28
Products:
GMAT 1: 570 Q42 V28
Posts: 1,042
Kudos: 924
Kudos
Add Kudos
Bookmarks
Bookmark this Post
KarishmaB maa'm , Would you like to explain a bit more on the 2nd question ? Why is the answer not t=60 to t=80 ? In that case , the flight goes upwards first and then  moves downwards.
KarishmaB

Anugmat740
­Facts: The graph refers to a plane's flight from one location to another. The vertical axis represents the distance, in kilometers, between the plane and its destination. The horizontal axis represents the time, t minutes, since takeoff.

Make the appropriate selection from each drop-down menu to complete each sentence so that it is consistent with the information presented in the graph.­


1) The plane was closer to its destination at

2) Of all of the 20-minute intervals beginning and ending at times labeled on the graph, the interval in which the plane traveled farthest toward its destination was the interval from 


Source: GMAT Prep
Attachment:
Aeroplane.png
­
­
The graph shows distance from destination on Y axis as time progresses on X axis. It starts at 240 km and ends at 0 which makes sense. The place of origin was 240 km away from the destination and time taken for the journey was 280 mins. 

1) The plane was closer to its destination at  __________ 

The graph is falling generally which makes sense since distance from destination will decrease as time passes. But it isn't an all smooth graph. There are some inflections in the graph - what do they show? Between 60 to 80, the graph is rising. At around 60 mins, distance to destination is about 185 km and at 80 mins, distance to destination is about 197 km. So the plane had to loop around perhaps because of bad weather or something.  
Hence the plane was closer to its destination at t = 60 than at t = 80

ANSWER: at t = 60 than at t = 80


2) Of all of the 20-minute intervals beginning and ending at times labeled on the graph, the interval in which the plane traveled farthest toward its destination was the interval from ______

The 20 min intervals labeled on the graph are 0 - 20 min, 20 - 40  mins etc.  The plane travel farthest in that interval in which the plane reduced the 'distance from destination' rapidly i.e. in which the graph fell rapidly. We can see that the slope of the graph is maximum between 180 - 200 mins. 

ANSWER: 180 - 200 mins
­
User avatar
KarishmaB
Joined: 16 Oct 2010
Last visit: 22 Sep 2026
Posts: 16,657
Own Kudos:
Given Kudos: 492
Location: Pune, India
Expert
Expert reply
Active GMAT Club Expert! Tag them with @ followed by their username for a faster response.
Posts: 16,657
Kudos: 81,486
Kudos
Add Kudos
Bookmarks
Bookmark this Post
sayan640
KarishmaB maa'm , Would you like to explain a bit more on the 2nd question ? Why is the answer not t=60 to t=80 ? In that case , the flight goes upwards first and then  moves downwards.
KarishmaB

Anugmat740
­Facts: The graph refers to a plane's flight from one location to another. The vertical axis represents the distance, in kilometers, between the plane and its destination. The horizontal axis represents the time, t minutes, since takeoff.

Make the appropriate selection from each drop-down menu to complete each sentence so that it is consistent with the information presented in the graph.­


1) The plane was closer to its destination at

2) Of all of the 20-minute intervals beginning and ending at times labeled on the graph, the interval in which the plane traveled farthest toward its destination was the interval from 


Source: GMAT Prep
Attachment:
Aeroplane.png
­
­
The graph shows distance from destination on Y axis as time progresses on X axis. It starts at 240 km and ends at 0 which makes sense. The place of origin was 240 km away from the destination and time taken for the journey was 280 mins. 

1) The plane was closer to its destination at  __________ 

The graph is falling generally which makes sense since distance from destination will decrease as time passes. But it isn't an all smooth graph. There are some inflections in the graph - what do they show? Between 60 to 80, the graph is rising. At around 60 mins, distance to destination is about 185 km and at 80 mins, distance to destination is about 197 km. So the plane had to loop around perhaps because of bad weather or something.  
Hence the plane was closer to its destination at t = 60 than at t = 80

ANSWER: at t = 60 than at t = 80


2) Of all of the 20-minute intervals beginning and ending at times labeled on the graph, the interval in which the plane traveled farthest toward its destination was the interval from ______

The 20 min intervals labeled on the graph are 0 - 20 min, 20 - 40  mins etc.  The plane travel farthest in that interval in which the plane reduced the 'distance from destination' rapidly i.e. in which the graph fell rapidly. We can see that the slope of the graph is maximum between 180 - 200 mins. 

ANSWER: 180 - 200 mins
­
­'farthest toward its destination' means it reduced the distance from destination to the maximum extent. In between 60 to 80, the plane increased its distance from destination so it was moving away from the destination for the most part. In 180 - 200 mins, it covered maximum distance toward the destination ( leftover distance fell from 110 km to 70 km in the span of these 20  mins)
User avatar
bumpbot
User avatar
Non-Human User
Joined: 09 Sep 2013
Last visit: 04 Jan 2021
Posts: 39,267
Own Kudos:
Posts: 39,267
Kudos: 1,162
Kudos
Add Kudos
Bookmarks
Bookmark this Post
Automated notice from GMAT Club BumpBot:

A member just gave Kudos to this thread, showing it’s still useful. I’ve bumped it to the top so more people can benefit. Feel free to add your own questions or solutions.

This post was generated automatically.
Moderators:
Math Expert
113797 posts
DI Forum Moderator
409 posts