Events & Promotions
|
|

GMAT Club Daily Prep
Thank you for using the timer - this advanced tool can estimate your performance and suggest more practice questions. We have subscribed you to Daily Prep Questions via email.
Customized
for You
Track
Your Progress
Practice
Pays
Not interested in getting valuable practice questions and articles delivered to your email? No problem, unsubscribe here.
 May 20
08:00 AM PDT
-08:30 AM PDT
What’s in it for you- Live Profile Evaluation Chat Session with Jenifer Turtschanow, CEO, ARINGO. Come with your details prepared and ARINGO will share insights! Pre-MBA Role/Industry, YOE, Exam Score, C/GPA, ECs Post-MBA Role/ Industry & School List. May 15
01:00 PM IST
-11:00 AM IST
Start your journey with a fully customized action plan and work with a dedicated mentor to achieve a 735+ score. May 19
12:00 PM PDT
-01:00 PM PDT
Scoring 329 on the GRE is not always about using more books, more courses, or a longer study plan. In this episode of GRE Success Talks, Ashutosh shares his GRE preparation strategy, study plan, and test-day experience, explaining how he kept his prep....- Jun 10
06:00 AM PDT
-06:15 PM PDT
Register for the GMAT Club Virtual MBA Spotlight Fair – the world’s premier event for serious MBA candidates. This is your chance to hear directly from Admissions Directors at nearly every Top 30 MBA program..

gmatexam439

GMAT 1: 730 Q49 V41
Posts: 1,053
Kudos
Bookmarks

Dropdown 1: t = 60 than at t = 80
Dropdown 2: t = 180 to t = 200
Be sure to select an answer first to save it in the Error Log before revealing the correct answer (OA)!
Difficulty:
 35%
(medium)
35%
(medium)
Question Stats:
68% (02:02) correct 32%
(02:15)
wrong
based on 2512
sessions
32%
(02:15)
wrong
based on 2512
sessions
History
Date
Time
Result
Not Attempted Yet
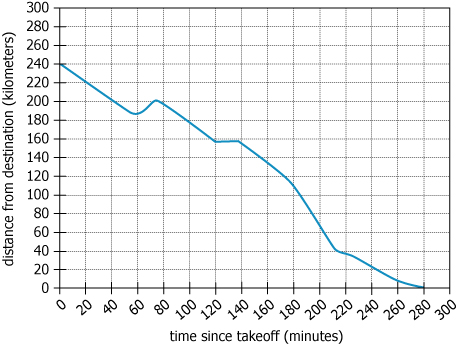
Facts: The graph refers to a plane's flight from one location to another. The vertical axis represents the distance, in kilometers, between the plane and its destination. The horizontal axis represents the time, t minutes, since takeoff.
Make the appropriate selection from each drop-down menu to complete each sentence so that it is consistent with the information presented in the graph.
The plane was closer to its destination at
Of all of the 20-minute intervals beginning and ending at times labeled on the graph, the interval in which the plane traveled farthest toward its destination was the interval from
ID: 100353
Exam Pack 1 CAT 4 IR

GMATPrep Exam 4 IR.PNG [ 95.85 KiB | Viewed 24371 times ]
Exam Pack 1 CAT 4 IR
Attachment:
GMATPrep Exam 4 IR.PNG [ 95.85 KiB | Viewed 24371 times ]
ShowHide Answer
Official Answer
Dropdown 1: t = 60 than at t = 80
Dropdown 2: t = 180 to t = 200
Question exposed a gap?
Take sectional Adaptive Quant, Verbal, or DI tests on GMAT Club and review the detailed score report.
Get started →

Kudos
Bookmarks
I made the same mistake on this IR question and was wondering how could they consider the plane to be closer at "t=60-80" instead of "t=240-260" but I guess we all missed the conjunction "than" which brings in comparison within each time frame. So ideally the question was asking whether
a. the plane was closer at t=60 than at t=80
OR
b. the plane was closer at t=240 than at t=260
Looking at the graph only in case of a the statement holds true as the plane was closer at t=60 and the distance increased at t=80
a. the plane was closer at t=60 than at t=80
OR
b. the plane was closer at t=240 than at t=260
Looking at the graph only in case of a the statement holds true as the plane was closer at t=60 and the distance increased at t=80

Kudos
Bookmarks
Hi..
For all those confused on the questions..
Question I
The first question talks of the interval when the distance from destination increased. So, in general as time elapses, the destination comes closer, so any move downwards and right is giving closeness to the destination..
But at 60 and 80, rather than moving downwards, it is moving upwards, so it is moving farther away from the destination during this interval. Now, the flight is not going to take an exact straight path towards the destination. It may be the plane has to take a small detour because of some disturbance or a no flying zone.
Even at interval 120-140, the distance remains constant
Answer - 60-80
Question II
You have to find the maximum distance that the plane travels in a time interval..
the answer is the interval where the drop is the steepest.. 180-200


