Events & Promotions
|
|

GMAT Club Daily Prep
Thank you for using the timer - this advanced tool can estimate your performance and suggest more practice questions. We have subscribed you to Daily Prep Questions via email.
Customized
for You
Track
Your Progress
Practice
Pays
Not interested in getting valuable practice questions and articles delivered to your email? No problem, unsubscribe here.
 May 07
01:00 AM EDT
-02:00 AM EDT
Learn how Keshav, a Chartered Accountant, scored an impressive 705 on GMAT in just 30 days with GMATWhiz's expert guidance. In this video, he shares preparation tips and strategies that worked for him, including the mock, time management, and..... May 06
12:30 AM EDT
-01:30 AM EDT
GMAT 615 to 715 in Just 15 Days! Riya’s 100-pt Improvement Strategy May 06
08:30 AM PDT
-09:30 AM PDT
In Episode 3 of our GMAT Ninja Critical Reasoning series, we tackle Discrepancy, Paradox, and Explain an Oddity questions. You know the feeling: the passage gives you two facts that seem completely contradictory....- May 08
08:00 AM PDT
-08:30 AM PDT
Join the special YouTube live-stream for selecting the winners of GMAT Club MBA Scholarships sponsored by Juno live. Watch who gets these coveted MBA scholarships offered by GMAT Club and Juno.  May 08
08:00 PM PDT
-09:00 PM PDT
Free- full-length test + 15 concept videos + 150+ short videos + study plan!

Kudos
Bookmarks

Dropdown 1: decrease
Dropdown 2: 500 GW
Be sure to select an answer first to save it in the Error Log before revealing the correct answer (OA)!
Difficulty:
 35%
(medium)
35%
(medium)
Question Stats:
74% (02:20) correct 26%
(02:28)
wrong
based on 1667
sessions
26%
(02:28)
wrong
based on 1667
sessions
History
Date
Time
Result
Not Attempted Yet
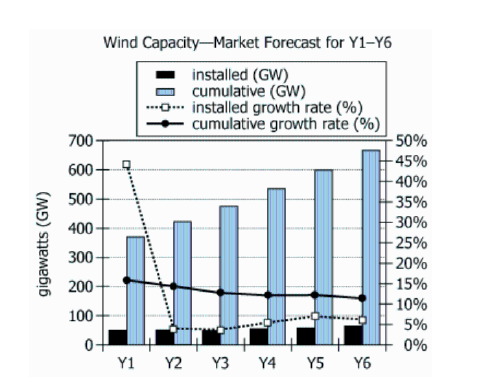
A global energy council forecasted the expected worldwide wind-turbine electricity generation capacity, in gigawatts (GW), for each of six consecutive upcoming years (Y1 – Y6). For each year, the graph shows the expected installed wind capacity (i.e., capacity that will be newly installed during that year) and expected cumulative wind capacity (i.e., total existing capacity at the end of that year). The graph also shows, for each of installed and cumulative capacity, the percent rate of growth for each year over the previous year.
From each drop-down menu, select the option that creates the most accurate statement according to the information provided.
From Y1 to Y6 the graph indicates that the expected annual percent rate of growth for cumulative wind capacity will .
To the nearest 50 GW, the median of the expected cumulative wind capacities from Y1 to Y6 is .
ID: 700365
ShowHide Answer
Official Answer
Dropdown 1: decrease
Dropdown 2: 500 GW
Solving this question helps.
Taking a timed set of similar questions in
GMAT Club Forum Quiz →
is even better.


Oppenheimer1945
Joined: 16 Jul 2019
Last visit: 27 Apr 2026
Posts: 782
Own Kudos:
Given Kudos: 236
Location: India
Schools: INSEAD '26 (D) ISB '27 (D) IIMB '26 (A) IIMA '26 (A) HEC '26 (D) LBS '26 IESE '27 (D) Fuqua '27 (WL) Tepper '27 (WL)
GMAT Focus 1: 645 Q90 V76 DI80 
GPA: 7.81
Schools: INSEAD '26 (D) ISB '27 (D) IIMB '26 (A) IIMA '26 (A) HEC '26 (D) LBS '26 IESE '27 (D) Fuqua '27 (WL) Tepper '27 (WL)
GMAT Focus 1: 645 Q90 V76 DI80
Posts: 782
Kudos:
664
Kudos
Bookmarks
naman79
Black line graph is slightly reducing.