Events & Promotions
|
|

GMAT Club Daily Prep
Thank you for using the timer - this advanced tool can estimate your performance and suggest more practice questions. We have subscribed you to Daily Prep Questions via email.
Customized
for You
Track
Your Progress
Practice
Pays
Not interested in getting valuable practice questions and articles delivered to your email? No problem, unsubscribe here.
 Jun 08
08:00 PM EDT
-10:00 PM EDT
Master the GMAT with expert live instruction, a personalized study plan, and real-time support. Includes 40 hours of online classes plus 6 months of access to the TTP GMAT OnDemand video course. Mon/Wed June 8, 2026 →August 12, 2026 8:00pm-10:00pm EST Jun 10
06:00 AM PDT
-06:15 PM PDT
Register for the GMAT Club Virtual MBA Spotlight Fair – the world’s premier event for serious MBA candidates. This is your chance to hear directly from Admissions Directors at nearly every Top 30 MBA program..- Jun 10
10:00 AM PDT
-11:00 AM PDT
Scoring 715 on the GMAT Focus Edition requires more than just learning formulas, memorizing concepts, or solving hundreds of questions. In this episode, Nishant shares how he improved his GMAT preparation by focusing on application of concepts, and more.  Jun 11
11:00 AM EDT
-01:00 PM EDT
TTP GMAT OnDemand gives serious students 400+ hours of expert video instruction, the full TTP course, AI support, weekly office hours, and a 715+ score guarantee—all built for elite GMAT score improvement.

Kudos
Bookmarks

Dropdown 1: decrease
Dropdown 2: 500 GW
Be sure to select an answer first to save it in the Error Log before revealing the correct answer (OA)!
Difficulty:
 35%
(medium)
35%
(medium)
Question Stats:
74% (02:19) correct 26%
(02:27)
wrong
based on 1697
sessions
26%
(02:27)
wrong
based on 1697
sessions
History
Date
Time
Result
Not Attempted Yet
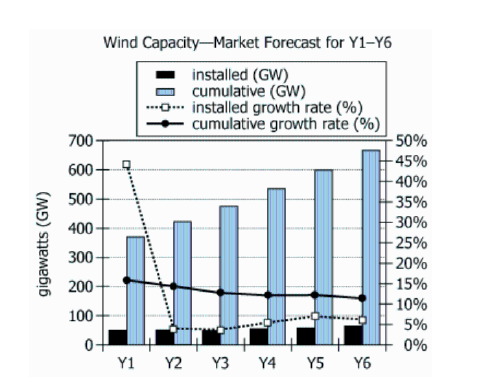
A global energy council forecasted the expected worldwide wind-turbine electricity generation capacity, in gigawatts (GW), for each of six consecutive upcoming years (Y1 – Y6). For each year, the graph shows the expected installed wind capacity (i.e., capacity that will be newly installed during that year) and expected cumulative wind capacity (i.e., total existing capacity at the end of that year). The graph also shows, for each of installed and cumulative capacity, the percent rate of growth for each year over the previous year.
From each drop-down menu, select the option that creates the most accurate statement according to the information provided.
From Y1 to Y6 the graph indicates that the expected annual percent rate of growth for cumulative wind capacity will .
To the nearest 50 GW, the median of the expected cumulative wind capacities from Y1 to Y6 is .
ID: 700365
ShowHide Answer
Official Answer
Dropdown 1: decrease
Dropdown 2: 500 GW
Solving this question helps.
Taking a timed set of similar questions in
GMAT Club Forum Quiz →
is even better.


Oppenheimer1945
Joined: 16 Jul 2019
Last visit: 06 Jun 2026
Posts: 772
Own Kudos:
Given Kudos: 236
Location: India
Schools: INSEAD '26 (D) ISB '27 (D) IIMB '26 (A) IIMA '26 (A) HEC '26 (D) LBS '26 IESE '27 (D) Fuqua '27 (WL) Tepper '27 (WL)
GMAT Focus 1: 645 Q90 V76 DI80 
GPA: 7.81
Schools: INSEAD '26 (D) ISB '27 (D) IIMB '26 (A) IIMA '26 (A) HEC '26 (D) LBS '26 IESE '27 (D) Fuqua '27 (WL) Tepper '27 (WL)
GMAT Focus 1: 645 Q90 V76 DI80
Posts: 772
Kudos:
672
Kudos
Bookmarks
naman79
Black line graph is slightly reducing.


