Events & Promotions
|
|

GMAT Club Daily Prep
Thank you for using the timer - this advanced tool can estimate your performance and suggest more practice questions. We have subscribed you to Daily Prep Questions via email.
Customized
for You
Track
Your Progress
Practice
Pays
Not interested in getting valuable practice questions and articles delivered to your email? No problem, unsubscribe here.
- Nov 20
07:30 AM PST
-08:30 AM PST
Learn what truly sets the UC Riverside MBA apart and how it helps in your professional growth - Nov 22
11:00 AM IST
-01:00 PM IST
Do RC/MSR passages scare you? e-GMAT is conducting a masterclass to help you learn – Learn effective reading strategies Tackle difficult RC & MSR with confidence Excel in timed test environment - Nov 23
11:00 AM IST
-01:00 PM IST
Attend this free GMAT Algebra Webinar and learn how to master the most challenging Inequalities and Absolute Value problems with ease. - Nov 25
10:00 AM EST
-11:00 AM EST
Prefer video-based learning? The Target Test Prep OnDemand course is a one-of-a-kind video masterclass featuring 400 hours of lecture-style teaching by Scott Woodbury-Stewart, founder of Target Test Prep and one of the most accomplished GMAT instructors.
Dropdown 1: 2.65
Dropdown 2: 1,500
Be sure to select an answer first to save it in the Error Log before revealing the correct answer (OA)!
Difficulty:
 35%
(medium)
Question Stats:
70% (02:46) correct 30%
(03:05)
wrong
  based on 1895
sessions
History
Date
Time
Result
Not Attempted Yet
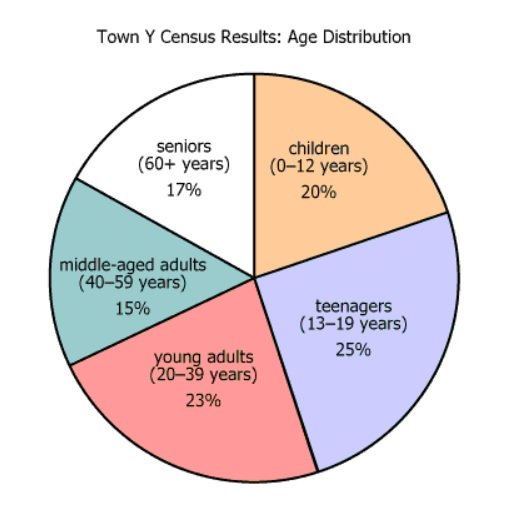
A recent census revealed the age distribution of the residents of Town Y, shown in the graph. Since the census was performed, no resident has moved into or away from Town Y and there have been no recorded births or deaths.
Based on the given information, use the drop-down menus to most accurately complete the following statements.
The census indicates that times as many residents were children or teenagers as were seniors.
If, at the time of the census, there were 540 more people aged 0–39 than people aged 40 or greater, then the population of Town Y at the time of the census was .
ID: 100407

2.jpg [ 45.26 KiB | Viewed 22902 times ]
Attachment:
2.jpg [ 45.26 KiB | Viewed 22902 times ]
ShowHide Answer
Official Answer
Dropdown 1: 2.65
Dropdown 2: 1,500
Kudos
Bookmarks
1)B, Children=20%
Teens=25% and seniors=17%
So ratio is 25+20/17= 45/17=2.65
2)A,Total % of people from 0-39= 20+25+23= 68% of total population
And rest is 32% of total population,Now given difference is 540= (68-32)of total population
Total population = 540*100/36=1500
Posted from my mobile device
Teens=25% and seniors=17%
So ratio is 25+20/17= 45/17=2.65
2)A,Total % of people from 0-39= 20+25+23= 68% of total population
And rest is 32% of total population,Now given difference is 540= (68-32)of total population
Total population = 540*100/36=1500
Posted from my mobile device
bM22

Retired Moderator
Joined: 05 May 2016
Last visit: 17 Jul 2025
Posts: 716
Given Kudos: 1,316
Location: India
Schools: IIM (A) IIM (A) IIM-A '24 (A) ISB '24 (A)
Kudos
Bookmarks
1. The census indicates that______________times as many residents were children or teenagers as were seniors.
Let the total population of Town Y be x.
Senior citizens make : 17% of x.
Children or Teenagers make: 45% of x.
Now we are asked: 45% of x = k17% of x.
k = 2.647 => ~ 2.65
Answer B.
2. If, at the time of the census, there were 540 more people aged 0–39 than people aged 40 or greater, then the population of Town Y at the time of the census was______________.
Let the total population of Town Y at the time of the census was x.
People aged 0-39 make up: 68% of x.
people aged 40 or greater make up: 32% of x.
Now, Given: 68% of x = 32% of x + 540
=> (36/100)x = 540 => x = 54000/36 = 1500.
Answer A.


