Events & Promotions
|
|

GMAT Club Daily Prep
Thank you for using the timer - this advanced tool can estimate your performance and suggest more practice questions. We have subscribed you to Daily Prep Questions via email.
Customized
for You
Track
Your Progress
Practice
Pays
Not interested in getting valuable practice questions and articles delivered to your email? No problem, unsubscribe here.
 Jun 08
08:00 PM EDT
-10:00 PM EDT
Master the GMAT with expert live instruction, a personalized study plan, and real-time support. Includes 40 hours of online classes plus 6 months of access to the TTP GMAT OnDemand video course. Mon/Wed June 8, 2026 →August 12, 2026 8:00pm-10:00pm EST Jun 10
06:00 AM PDT
-06:15 PM PDT
Register for the GMAT Club Virtual MBA Spotlight Fair – the world’s premier event for serious MBA candidates. This is your chance to hear directly from Admissions Directors at nearly every Top 30 MBA program..- Jun 10
10:00 AM PDT
-11:00 AM PDT
Scoring 715 on the GMAT Focus Edition requires more than just learning formulas, memorizing concepts, or solving hundreds of questions. In this episode, Nishant shares how he improved his GMAT preparation by focusing on application of concepts, and more.  Jun 11
11:00 AM EDT
-01:00 PM EDT
TTP GMAT OnDemand gives serious students 400+ hours of expert video instruction, the full TTP course, AI support, weekly office hours, and a 715+ score guarantee—all built for elite GMAT score improvement.


Kudos
Bookmarks
Dropdown 1: negatively correlated
Dropdown 2: 8
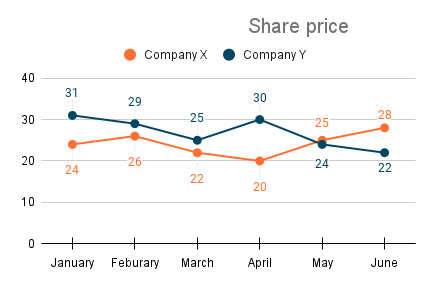
The graph above shows the share prices of Company X and Company Y over the first six months of 2021, based on the last working day of each month.
Select from each drop-down menu the option that creates the most accurate statement, given the information provided.
Based on the graph above, the share prices of the companies are .
The range of the share price of Company X on the last working day for the six months shown in the graph is .
ShowHide Answer
Official Answer
Dropdown 1: negatively correlated
Dropdown 2: 8
Kudos
Bookmarks
Official Solution:
Drop-down 1:
Two data sets are positively correlated if they both tend to be higher in the same cases. They are negatively correlated if one tends to be higher in cases where the other is lower. For positively correlated data, their lines tend to slope up or down together; the more consistently this happens, the stronger the positive correlation. Conversely, when two data sets are negatively correlated, the line for one tends to slope up while the other slopes down, and vice versa. The more consistently these opposite slopes occur, the stronger the negative correlation.
Examining the graph, we observe that the lines for the shares of Company X and Y slope in opposite directions in 4 out of 5 cases. Thus, we can conclude that the share prices are negatively correlated.
Drop-down 2:
The range is the difference between the highest value and the lowest value. The highest price for Company X's share was in June at 28, and the lowest price was in April at 20, making the range equal to 28 - 20 = 8.
Correct answer:
Dropdown 1: "negatively correlated"
Dropdown 2: "8"
Bunuel
Drop-down 1:
Two data sets are positively correlated if they both tend to be higher in the same cases. They are negatively correlated if one tends to be higher in cases where the other is lower. For positively correlated data, their lines tend to slope up or down together; the more consistently this happens, the stronger the positive correlation. Conversely, when two data sets are negatively correlated, the line for one tends to slope up while the other slopes down, and vice versa. The more consistently these opposite slopes occur, the stronger the negative correlation.
Examining the graph, we observe that the lines for the shares of Company X and Y slope in opposite directions in 4 out of 5 cases. Thus, we can conclude that the share prices are negatively correlated.
Drop-down 2:
The range is the difference between the highest value and the lowest value. The highest price for Company X's share was in June at 28, and the lowest price was in April at 20, making the range equal to 28 - 20 = 8.
Correct answer:
Dropdown 1: "negatively correlated"
Dropdown 2: "8"
Kudos
Bookmarks
I have revised the question, solution, and formatting by adding more details to enhance clarity.