Events & Promotions
|
|

GMAT Club Daily Prep
Thank you for using the timer - this advanced tool can estimate your performance and suggest more practice questions. We have subscribed you to Daily Prep Questions via email.
Customized
for You
Track
Your Progress
Practice
Pays
Not interested in getting valuable practice questions and articles delivered to your email? No problem, unsubscribe here.
 Sep 02
08:00 PM PDT
-09:00 PM PDT
Video explanations + diagnosis of 10 weakest areas + 150+ short videos + study plan! Sep 03
01:30 AM EDT
-02:30 AM EDT
At one point, she believed GMAT wasn’t for her. After scoring 595, self-doubt crept in and she questioned her potential. But instead of quitting, she made the right strategic changes. The result? A remarkable comeback to 695. Check out how Saakshi did it. Aug 27
10:00 AM EDT
-11:00 AM EDT
We’ve worked incredibly hard to build TTP into the best test prep experience possible, and it would mean a lot to us to win Newsweek’s 2026 Readers’ Choice Award for Best Test Prep. If TTP has helped you, we’d be incredibly grateful for your vote. Sep 02
12:30 AM EDT
-01:30 AM EDT
Thought your job leaves no time for GMAT prep? After multiple GMAT attempts and a demanding consulting job, Kshitij improved to 695 in under 2 months. Learn the mindset shifts, study strategy, and execution changes that made the breakthrough possible. Sep 02
01:00 PM EDT
-11:59 PM EDT
Take 30% off all study plans with code COURSEWORK - Expires on Monday 9/7 Sep 04
10:00 AM PDT
-11:00 AM PDT
What does test anxiety really look like on the GMAT? For many test takers, it does not look like a panic attack. Instead, it shows up as brain fog, rereading, negative comparisons, mental noise.... Sep 06
09:30 AM EDT
-12:30 PM EST
Top scores are possible when you enroll in a powerful EA course, taught live online + 6 months access to TTP OnDemand video courses included! Perfect class schedule and easy course access for working professionals. Class starts Sundays Sept. 6, 2026.- Sep 07
12:01 AM PDT
-11:59 PM PDT
On the 7th, GMAT Club Tests will be Free! Including all the Quizzes, Questions, and Tests. 12 AM - 11:59 PM PDT - Sep 09
07:00 AM PDT
-10:00 AM PDT
Meet AdComs and explore top Master’s programs - MiM, MiF, MSc, MSBA and more. - Application Fee Waivers - Free 1-Week of GMAT Club Tests: - Master's Application Toolkit - Grand Prize Giveaway  Sep 15
07:00 PM EDT
-09:00 PM EST
Elite scores are possible when you enroll in a powerful GMAT course, taught live online + 6 months access to TTP OnDemand video courses included! Class starts Tues/Thurs Sept. 15, 2026 - Nov. 15, 2027, 7:00pm-9:00pm EST Sep 21
08:00 PM EDT
-10:00 PM EDT
Boost your GMAT score in less than one month in a live online class + 6 months access to TTP OnDemand video courses included! Class starts Mon, Tues, Wed, Thur, Fri Sept. 21, 2026 - Oct. 9, 2027, 7:00pm-10:00pm EST

bhanu29


GMAT Forum Director
Joined: 02 Oct 2024
Last visit: 02 Sep 2026
Posts: 797
Given Kudos: 745
Location: India
Schools: Anderson '27 Booth '27 Foster '27 Haas '27 Ross '27 Tepper '27 Stanford '27 CBS '27 NYU Stern Johnson (Cornell) McCombs '27 Kellogg '27 Sloan '27
GMAT Focus 1: 675 Q87 V85 DI79 
GMAT Focus 2: 715 Q87 V84 DI86
GPA: 9.11
WE:Engineering (Technology)
Products:
Schools: Anderson '27 Booth '27 Foster '27 Haas '27 Ross '27 Tepper '27 Stanford '27 CBS '27 NYU Stern Johnson (Cornell) McCombs '27 Kellogg '27 Sloan '27
GMAT Focus 2: 715 Q87 V84 DI86
Posts: 797
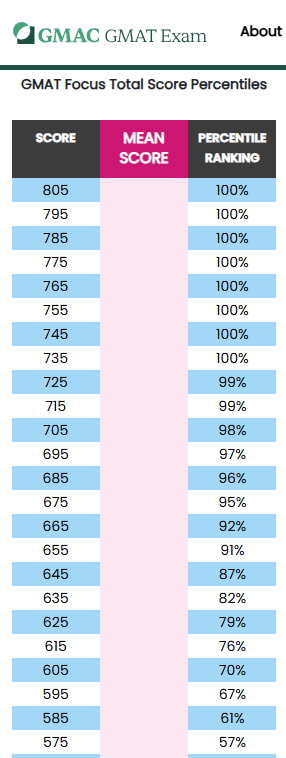
GMAC has updated the official percentiles today. This is the third August in a row that the update has landed at roughly the same point in the calendar, so the timing itself is no longer a surprise.
Link to the new percentiles on mba.com
Below is the full comparison against last year's table, followed by the section percentiles and what the movement actually says about the testing pool.
Earlier
Now

SUMMARY
23 of the 61 total-score points moved. Every single one of them moved by exactly 1 percentile point. Nothing moved by 2 or more, in either direction.
The section tables are the more interesting half of this release. Quant, Verbal and DI did not move together, and they did not move in the same direction. Full breakdown further down.
TOTAL SCORE - EVERY ROW THAT MOVED
Key anchors that did not move: 805 to 745 all remain 100th, 725 and 715 remain 99th, 705 remains 98th, 695 remains 97th, 575 remains 57th, 545 remains 42nd, 505 remains 27th.
ANALYSIS
The bad
The good
WHAT ACTUALLY CHANGED IN THE POOL
Reading the deltas one row at a time understates what happened. It is more useful to convert the cumulative percentiles into the share of test takers sitting inside each band. The reason for doing this is that a cumulative table hides where the mass moved, and the band view does not.
It is interesting to note that the movement runs in both directions at once. The 605 to 705 band picked up a point of the pool and the 205 to 405 band also picked up a point, while the 405 to 605 middle gave up two points between them. The distribution did not inflate, it spread out. More candidates are now clustered just below 705 than a year ago, and slightly more are at the very bottom, with the middle thinning.
That is the mechanism behind the headline. Scores in the 555 to 735 range each lost a percentile point because the group immediately beneath them got more crowded, not because anyone's performance was re-graded.
SECTION PERCENTILES (CURRENT)
The combined table below is the new 2026 figures for all three sections. The year on year section comparison follows it.
Mean scaled scores: Quant 77.92, Verbal 79.43, Data Insights 75.14. DI remains the lowest scoring section of the three.
SECTION YEAR ON YEAR - THE THREE SECTIONS SPLIT
This is the part of the release worth reading closely. 34 section percentile points moved in total, and they did not move together.
Quant - 12 moved, 10 of them upward
Everything from 67 to 76 gained percentile. A mid range Quant score is worth more this year than last, which means fewer candidates are clearing those scores than a year ago. The only Quant losses are at 87 and 88, one point each.
Verbal - 11 moved, 9 of them downward
Verbal 80, 81, 83 and 84 each fell 2 points. Those are the four largest single moves anywhere in this release, total score included. The entire 79 to 88 stretch went down, so the upper middle of the Verbal pool is meaningfully stronger than it was in 2025.
DI - 11 moved, every single one downward
DI is the only section with no upward movement at all. Eleven scores moved and all eleven went down, spread evenly from 60 all the way to 81. The whole DI field shifted up by a small, consistent amount.
WHAT THE SECTION SPLIT MEANS
Summing the deltas gives the cleanest read of it. Quant nets +10 percentile points across all its moved scores, Verbal nets -11, and DI nets -11.
It is interesting to note that this is the second year in a row the same split has appeared. In the August 2025 thread the observation was that the minor inflation was showing up in Verbal and DI with nothing visible in Quant. That pattern has not only held, it has become clearer, with Quant now moving measurably in the opposite direction rather than staying flat.
Read plainly, candidates are getting better at Verbal and Data Insights and slightly worse at mid range Quant. The reason this matters for a current test taker is that it changes where a given scaled point is scarce, though it does not change any target worth setting.
The reassuring part
Despite 34 section points moving, the scaled score required to hit every standard percentile threshold is identical in both years, in all three sections.
Not one of those 18 figures changed between 2025 and 2026. If you had a section target last week, it is the same target today.
THE SECTION FINDING WORTH ACTING ON
Comparing the three sections at the same scaled score shows how differently they are priced.
A scaled 82 is the 93rd percentile in DI, the 75th in Quant, and the 73rd in Verbal. To reach the 90th percentile you need an 86 in Quant but only an 82 in DI, a gap of 4 scaled points for the identical percentile. The reason is straightforward, DI has the lowest mean of the three sections at 75.14, so the same raw performance clears a larger share of the field.
Two practical consequences follow from this.
Verbal is also the steepest section overall through the middle. Going from 80 to 84 moves you from the 54th to the 87th percentile, 33 percentile points for 4 scaled points. The same 4 point climb in Quant is worth 21 points and in DI is worth 14.
QUESTIONS
My score report says one percentile and mba.com says another. Which is right?
The published table is the current one. In past updates the percentile shown against an existing score was refreshed in the reporting system rather than frozen at the value from the test date, so expect the reported figure to follow the new table.
I have already submitted applications with the old percentile. Does that matter?
A 1 point move does not change how an application reads. Adcoms work from the score, and a 675 that reads 94th instead of 95th is the same 675. There is nothing here that warrants contacting a school.
Does this mean I need a higher score than last year?
No. The score you need is set by the schools you are applying to, and the underlying scores have not changed. What changed is the percentile label attached to them, by one point, for scores between 555 and 735.
Why did the bottom of the scale go up while the middle went down?
Those two movements are not in conflict. The 205 to 405 band and the 605 to 705 band each gained a point of the pool while the 405 to 605 middle lost two points between them. The distribution widened at both ends rather than shifting in one direction.
Which section should I be putting my time into?
That is set by your own splits, not by this update. What the update does tell you is that DI remains the cheapest percentile on the exam and Verbal remains the steepest through the middle, and neither of those facts changed this year. The section score needed for every percentile threshold from the 50th to the 95th is the same as it was in 2025.
Verbal fell 2 points at four different scores. Is Verbal getting harder?
The test is not getting harder. The Verbal pool is getting stronger, which is a different thing. A 2 point percentile drop at Verbal 84 means slightly more candidates now score at or above an 84 than did a year ago. Your own preparation is unaffected by that.
How often does this happen?
The last three updates have all landed in August. On that pattern the next refresh would be expected around August 2027, though GMAC has not committed to a schedule.
Should I retake because of this?
Not on the basis of a 1 point percentile move. If you were already considering a retake because your score is short of your target range, that reasoning is unchanged by this update.
RELATED THREADS
If you want your own score checked against the new table, post it below with the section splits and I will add it to the thread.
Link to the new percentiles on mba.com
Below is the full comparison against last year's table, followed by the section percentiles and what the movement actually says about the testing pool.
Earlier
Now
SUMMARY
23 of the 61 total-score points moved. Every single one of them moved by exactly 1 percentile point. Nothing moved by 2 or more, in either direction.
- 555 through 735 moved down 1 point. 14 score points, and this is the band that covers most competitive applicants.
- 255 through 485 moved up 1 point. 9 score points at the bottom of the scale.
- Everything else held. 38 of 61 score points are unchanged, including the entire 745 to 805 range and the 495 to 545 range.
The section tables are the more interesting half of this release. Quant, Verbal and DI did not move together, and they did not move in the same direction. Full breakdown further down.
TOTAL SCORE - EVERY ROW THAT MOVED
| Score | 2026 | 2025 | Delta |
| 735 | 99% | 100% | -1 |
| 685 | 95% | 96% | -1 |
| 675 | 94% | 95% | -1 |
| 665 | 91% | 92% | -1 |
| 655 | 90% | 91% | -1 |
| 645 | 86% | 87% | -1 |
| 635 | 81% | 82% | -1 |
| 625 | 78% | 79% | -1 |
| 615 | 75% | 76% | -1 |
| 605 | 69% | 70% | -1 |
| 595 | 66% | 67% | -1 |
| 585 | 60% | 61% | -1 |
| 565 | 50% | 51% | -1 |
| 555 | 47% | 48% | -1 |
| 485 | 22% | 21% | +1 |
| 455 | 16% | 15% | +1 |
| 405 | 8% | 7% | +1 |
| 395 | 7% | 6% | +1 |
| 385 | 6% | 5% | +1 |
| 355 | 4% | 3% | +1 |
| 335 | 3% | 2% | +1 |
| 305 | 2% | 1% | +1 |
| 255 | 1% | 0% | +1 |
Key anchors that did not move: 805 to 745 all remain 100th, 725 and 715 remain 99th, 705 remains 98th, 695 remains 97th, 575 remains 57th, 545 remains 42nd, 505 remains 27th.
ANALYSIS
The bad
- 675 is the only score that crossed a round threshold. It fell from the 95th to the 94th percentile. If you have been writing "95th percentile" on a resume off a 675, that line is now out of date.
- 735 is no longer a clean 100th. It now reports as 99th. The practical difference is nil, though the reported figure has changed.
- The hit landed squarely on the applicant range. 555 to 735 covers the scores most people in this forum are actually reporting. All 14 points in that stretch went down.
The good
- No score moved more than 1 point. In the August 2024 update several scores moved further, and the speculation before that release was worse than the release itself. The same holds here.
- 705 held at the 98th percentile. The score that took the most attention in previous updates did not move at all this year.
- The top of the scale is completely untouched. 745 through 805 remain at 100th, exactly as in 2025.
- This is normal drift, not a re-scaling. A 1 point move in a cumulative percentile table means a fraction of a percent of the pool shifted across that score. It is a routine annual refresh of the reference group.
WHAT ACTUALLY CHANGED IN THE POOL
Reading the deltas one row at a time understates what happened. It is more useful to convert the cumulative percentiles into the share of test takers sitting inside each band. The reason for doing this is that a cumulative table hides where the mass moved, and the band view does not.
| Band | 2026 | 2025 | Shift |
| 205 - 405 | 8% | 7% | +1 pt |
| 405 - 505 | 19% | 20% | -1 pt |
| 505 - 605 | 42% | 43% | -1 pt |
| 605 - 705 | 29% | 28% | +1 pt |
| Above 705 | 2% | 2% | no change |
It is interesting to note that the movement runs in both directions at once. The 605 to 705 band picked up a point of the pool and the 205 to 405 band also picked up a point, while the 405 to 605 middle gave up two points between them. The distribution did not inflate, it spread out. More candidates are now clustered just below 705 than a year ago, and slightly more are at the very bottom, with the middle thinning.
That is the mechanism behind the headline. Scores in the 555 to 735 range each lost a percentile point because the group immediately beneath them got more crowded, not because anyone's performance was re-graded.
SECTION PERCENTILES (CURRENT)
The combined table below is the new 2026 figures for all three sections. The year on year section comparison follows it.
| Score | Quant | Verbal | DI |
| 90 | 100% | 100% | 100% |
| 89 | 97% | 99% | 100% |
| 88 | 95% | 98% | 99% |
| 87 | 93% | 97% | 99% |
| 86 | 91% | 96% | 99% |
| 85 | 88% | 93% | 98% |
| 84 | 85% | 87% | 97% |
| 83 | 80% | 81% | 95% |
| 82 | 75% | 73% | 93% |
| 81 | 70% | 64% | 88% |
| 80 | 64% | 54% | 83% |
| 79 | 57% | 46% | 76% |
| 78 | 50% | 38% | 69% |
| 77 | 43% | 30% | 61% |
| 76 | 38% | 23% | 52% |
| 75 | 33% | 18% | 46% |
| 74 | 28% | 14% | 40% |
| 73 | 23% | 11% | 34% |
| 72 | 20% | 8% | 29% |
| 71 | 17% | 6% | 24% |
| 70 | 14% | 4% | 20% |
| 69 | 11% | 3% | 17% |
| 68 | 9% | 3% | 14% |
| 67 | 7% | 2% | 11% |
| 66 | 5% | 2% | 10% |
| 65 | 4% | 2% | 8% |
| 64 | 3% | 1% | 7% |
| 63 | 2% | 1% | 5% |
| 62 | 2% | 1% | 5% |
| 61 | 1% | 1% | 4% |
| 60 | 1% | 1% | 3% |
Mean scaled scores: Quant 77.92, Verbal 79.43, Data Insights 75.14. DI remains the lowest scoring section of the three.
SECTION YEAR ON YEAR - THE THREE SECTIONS SPLIT
This is the part of the release worth reading closely. 34 section percentile points moved in total, and they did not move together.
Quant - 12 moved, 10 of them upward
| Score | 2026 | 2025 | Delta |
| 88 | 95% | 96% | -1 |
| 87 | 93% | 94% | -1 |
| 76 | 38% | 37% | +1 |
| 75 | 33% | 32% | +1 |
| 74 | 28% | 26% | +2 |
| 73 | 23% | 22% | +1 |
| 72 | 20% | 19% | +1 |
| 71 | 17% | 15% | +2 |
| 70 | 14% | 13% | +1 |
| 69 | 11% | 10% | +1 |
| 68 | 9% | 8% | +1 |
| 67 | 7% | 6% | +1 |
Everything from 67 to 76 gained percentile. A mid range Quant score is worth more this year than last, which means fewer candidates are clearing those scores than a year ago. The only Quant losses are at 87 and 88, one point each.
Verbal - 11 moved, 9 of them downward
| Score | 2026 | 2025 | Delta |
| 88 | 98% | 99% | -1 |
| 87 | 97% | 98% | -1 |
| 85 | 93% | 94% | -1 |
| 84 | 87% | 89% | -2 |
| 83 | 81% | 83% | -2 |
| 82 | 73% | 74% | -1 |
| 81 | 64% | 66% | -2 |
| 80 | 54% | 56% | -2 |
| 79 | 46% | 47% | -1 |
| 73 | 11% | 10% | +1 |
| 65 | 2% | 1% | +1 |
Verbal 80, 81, 83 and 84 each fell 2 points. Those are the four largest single moves anywhere in this release, total score included. The entire 79 to 88 stretch went down, so the upper middle of the Verbal pool is meaningfully stronger than it was in 2025.
DI - 11 moved, every single one downward
| Score | 2026 | 2025 | Delta |
| 81 | 88% | 89% | -1 |
| 77 | 61% | 62% | -1 |
| 76 | 52% | 53% | -1 |
| 75 | 46% | 47% | -1 |
| 74 | 40% | 41% | -1 |
| 73 | 34% | 35% | -1 |
| 71 | 24% | 25% | -1 |
| 70 | 20% | 21% | -1 |
| 67 | 11% | 12% | -1 |
| 63 | 5% | 6% | -1 |
| 60 | 3% | 4% | -1 |
DI is the only section with no upward movement at all. Eleven scores moved and all eleven went down, spread evenly from 60 all the way to 81. The whole DI field shifted up by a small, consistent amount.
WHAT THE SECTION SPLIT MEANS
Summing the deltas gives the cleanest read of it. Quant nets +10 percentile points across all its moved scores, Verbal nets -11, and DI nets -11.
It is interesting to note that this is the second year in a row the same split has appeared. In the August 2025 thread the observation was that the minor inflation was showing up in Verbal and DI with nothing visible in Quant. That pattern has not only held, it has become clearer, with Quant now moving measurably in the opposite direction rather than staying flat.
Read plainly, candidates are getting better at Verbal and Data Insights and slightly worse at mid range Quant. The reason this matters for a current test taker is that it changes where a given scaled point is scarce, though it does not change any target worth setting.
The reassuring part
Despite 34 section points moving, the scaled score required to hit every standard percentile threshold is identical in both years, in all three sections.
| Percentile | Quant | Verbal | DI |
| 50th | 78 | 80 | 76 |
| 60th | 80 | 81 | 77 |
| 70th | 81 | 82 | 79 |
| 80th | 83 | 83 | 80 |
| 90th | 86 | 85 | 82 |
| 95th | 88 | 86 | 83 |
Not one of those 18 figures changed between 2025 and 2026. If you had a section target last week, it is the same target today.
THE SECTION FINDING WORTH ACTING ON
Comparing the three sections at the same scaled score shows how differently they are priced.
| Target | Quant | Verbal | DI |
| 80th percentile | 83 | 83 | 80 |
| 90th percentile | 86 | 85 | 82 |
| 95th percentile | 88 | 86 | 83 |
A scaled 82 is the 93rd percentile in DI, the 75th in Quant, and the 73rd in Verbal. To reach the 90th percentile you need an 86 in Quant but only an 82 in DI, a gap of 4 scaled points for the identical percentile. The reason is straightforward, DI has the lowest mean of the three sections at 75.14, so the same raw performance clears a larger share of the field.
Two practical consequences follow from this.
- DI is the cheapest percentile on the exam. If your DI is sitting in the 70s and your Quant is already in the mid 80s, the next point of total score is far easier to find in DI.
- Verbal 80 to 81 buys more percentile than any other single point on the exam. That one scaled point moves you from the 54th to the 64th percentile, a 10 point jump. Verbal 81 to 82 is worth another 9. No single scaled point anywhere else on the exam pays that much, the best Quant equivalent is 7 points and the best DI equivalent is 9.
Verbal is also the steepest section overall through the middle. Going from 80 to 84 moves you from the 54th to the 87th percentile, 33 percentile points for 4 scaled points. The same 4 point climb in Quant is worth 21 points and in DI is worth 14.
QUESTIONS
My score report says one percentile and mba.com says another. Which is right?
The published table is the current one. In past updates the percentile shown against an existing score was refreshed in the reporting system rather than frozen at the value from the test date, so expect the reported figure to follow the new table.
I have already submitted applications with the old percentile. Does that matter?
A 1 point move does not change how an application reads. Adcoms work from the score, and a 675 that reads 94th instead of 95th is the same 675. There is nothing here that warrants contacting a school.
Does this mean I need a higher score than last year?
No. The score you need is set by the schools you are applying to, and the underlying scores have not changed. What changed is the percentile label attached to them, by one point, for scores between 555 and 735.
Why did the bottom of the scale go up while the middle went down?
Those two movements are not in conflict. The 205 to 405 band and the 605 to 705 band each gained a point of the pool while the 405 to 605 middle lost two points between them. The distribution widened at both ends rather than shifting in one direction.
Which section should I be putting my time into?
That is set by your own splits, not by this update. What the update does tell you is that DI remains the cheapest percentile on the exam and Verbal remains the steepest through the middle, and neither of those facts changed this year. The section score needed for every percentile threshold from the 50th to the 95th is the same as it was in 2025.
Verbal fell 2 points at four different scores. Is Verbal getting harder?
The test is not getting harder. The Verbal pool is getting stronger, which is a different thing. A 2 point percentile drop at Verbal 84 means slightly more candidates now score at or above an 84 than did a year ago. Your own preparation is unaffected by that.
How often does this happen?
The last three updates have all landed in August. On that pattern the next refresh would be expected around August 2027, though GMAC has not committed to a schedule.
Should I retake because of this?
Not on the basis of a 1 point percentile move. If you were already considering a retake because your score is short of your target range, that reasoning is unchanged by this update.
RELATED THREADS
- Official GMAT percentiles have been updated (Aug 2025)
- GMAT Focus Percentiles Changed (Aug 2024)
- GMAT Focus Score Calculator
If you want your own score checked against the new table, post it below with the section splits and I will add it to the thread.
Attachments
Screenshot 2026-08-13 at 3.47.19 AM.jpg [ 136.72 KiB | Viewed 1769 times ]


 12 Aug 2026, 15:19
Kudos
Bookmarks
Thank you! It seems this was a fairly minor update was just some housekeeping items... seems more and more people are scoring higher and higher on the GMAT focus. And I guess it takes just a single person I’ll shift at the top to cascade everything down by one.
This could be a matter of 500 people’s scoring higher this year because the volume is low. 😬
This could be a matter of 500 people’s scoring higher this year because the volume is low. 😬
12 Aug 2026, 15:30
Kudos
Bookmarks
Actually it’s two changes:
1. 735 - so people scoring at or above this mark is now significant enough to be a half a percent so GMA around it up to 1%. (that’s my assumption how they calculate things since they have 100 percentile)
2. 685 also added some folks and that pushed everyone else down, so just two non-uniform data points and both a fairly high. One is very high
1. 735 - so people scoring at or above this mark is now significant enough to be a half a percent so GMA around it up to 1%. (that’s my assumption how they calculate things since they have 100 percentile)
2. 685 also added some folks and that pushed everyone else down, so just two non-uniform data points and both a fairly high. One is very high