Events & Promotions
|
|

GMAT Club Daily Prep
Thank you for using the timer - this advanced tool can estimate your performance and suggest more practice questions. We have subscribed you to Daily Prep Questions via email.
Customized
for You
Track
Your Progress
Practice
Pays
Not interested in getting valuable practice questions and articles delivered to your email? No problem, unsubscribe here.
 May 19
12:00 PM PDT
-01:00 PM PDT
Scoring 329 on the GRE is not always about using more books, more courses, or a longer study plan. In this episode of GRE Success Talks, Ashutosh shares his GRE preparation strategy, study plan, and test-day experience, explaining how he kept his prep.... May 20
08:00 AM PDT
-08:30 AM PDT
What’s in it for you- Live Profile Evaluation Chat Session with Jenifer Turtschanow, CEO, ARINGO. Come with your details prepared and ARINGO will share insights! Pre-MBA Role/Industry, YOE, Exam Score, C/GPA, ECs Post-MBA Role/ Industry & School List. May 15
01:00 PM IST
-11:00 AM IST
Start your journey with a fully customized action plan and work with a dedicated mentor to achieve a 735+ score.- Jun 10
06:00 AM PDT
-06:15 PM PDT
Register for the GMAT Club Virtual MBA Spotlight Fair – the world’s premier event for serious MBA candidates. This is your chance to hear directly from Admissions Directors at nearly every Top 30 MBA program..


Kudos
Bookmarks

Dropdown 1: 2010–2011
Dropdown 2: 700
Be sure to select an answer first to save it in the Error Log before revealing the correct answer (OA)!
Difficulty:
 55%
(hard)
55%
(hard)
Question Stats:
62% (02:13) correct 38%
(02:16)
wrong
based on 518
sessions
38%
(02:16)
wrong
based on 518
sessions
History
Date
Time
Result
Not Attempted Yet
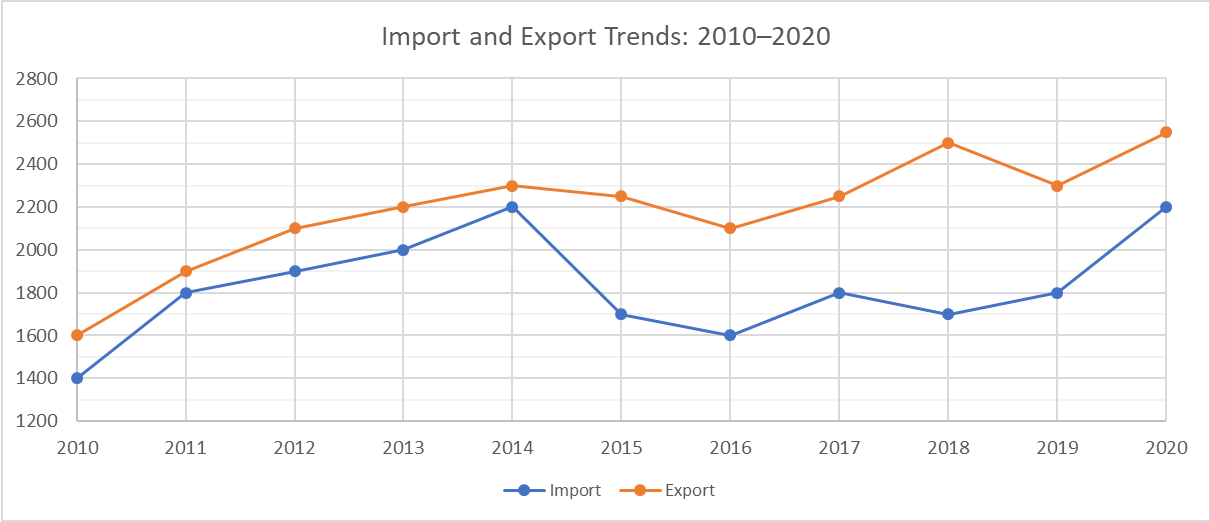
The chart shows Country X’s import and export figures (in billions of dollars) from 2010 to 2020. The blue line represents imports, and the orange line represents exports. A trade surplus occurs when exports exceed imports, while a trade deficit occurs when imports exceed exports. The difference between exports and imports is referred to as the balance of trade.
From each drop-down menu, select the option that creates the most accurate statement based on the information provided.
The greatest percentage increase in imports occurred during the period .
The range of the trade balance over the period 2010 to 2020 was .
ShowHide Answer
Official Answer
Dropdown 1: 2010–2011
Dropdown 2: 700
Kudos
Bookmarks
Official Solution:
Drop-down 1:
There’s no need to calculate percentage changes for every year. Notice that in 2010, the import figure was the lowest on the chart. The line from 2010 to 2011 is the steepest starting from the lowest base, which results in the greatest percentage increase. Although the increase from 2019 to 2020 is also steep, it starts from a higher base (the 2019 amount). Therefore, the greatest percentage increase in imports occurred during the period 2010–2011.
Drop-down 2:
To calculate the range of the trade balance, we need to find the difference between the highest trade balance and the lowest trade balance during the period. The highest trade balance occurred in 2018, equal to 2500 − 1700 = 800. The lowest trade balance occurred in 2011, equal to 1800 − 1700 = 100. Therefore, the range of the trade balance is 800 − 100 = 700.
Correct answer:
Dropdown 1: "2010–2011"
Dropdown 2: "700"
Bunuel
Drop-down 1:
There’s no need to calculate percentage changes for every year. Notice that in 2010, the import figure was the lowest on the chart. The line from 2010 to 2011 is the steepest starting from the lowest base, which results in the greatest percentage increase. Although the increase from 2019 to 2020 is also steep, it starts from a higher base (the 2019 amount). Therefore, the greatest percentage increase in imports occurred during the period 2010–2011.
Drop-down 2:
To calculate the range of the trade balance, we need to find the difference between the highest trade balance and the lowest trade balance during the period. The highest trade balance occurred in 2018, equal to 2500 − 1700 = 800. The lowest trade balance occurred in 2011, equal to 1800 − 1700 = 100. Therefore, the range of the trade balance is 800 − 100 = 700.
Correct answer:
Dropdown 1: "2010–2011"
Dropdown 2: "700"
General Discussion


Kudos
Bookmarks
Hi
I am a bit confused for highest % increase for period 2010 to 11 and 2019 to 20. Both have same slope.
Can anyone explain pls?
I am a bit confused for highest % increase for period 2010 to 11 and 2019 to 20. Both have same slope.
Can anyone explain pls?