Events & Promotions
|
|

GMAT Club Daily Prep
Thank you for using the timer - this advanced tool can estimate your performance and suggest more practice questions. We have subscribed you to Daily Prep Questions via email.
Customized
for You
Track
Your Progress
Practice
Pays
Not interested in getting valuable practice questions and articles delivered to your email? No problem, unsubscribe here.
 Jun 03
08:30 AM PDT
-09:30 AM PDT
In Episode 7 of our GMAT Ninja CR series, we are rounding up the oddballs, the misfits, and the format-benders: EXCEPT, Fill-In-The-Blanks, and other unusual Critical Reasoning question types. When you see a question that ends with a literal blank line May 29
10:00 AM IST
-11:00 PM IST
Start your journey with a fully customized action plan and work with a dedicated mentor to achieve a 735+ score.- Jun 02
10:00 AM PDT
-11:00 AM PDT
Probability is one of the most important GMAT Quant topics because it often combines logic, counting, set theory, and permutations & combinations. Many students try to solve probability questions by listing every possible case, but GMAT probability... - Jun 04
08:30 AM PDT
-09:30 AM PDT
For most test takers, Data Insights is the most challenging section on the GMAT, with test takers scoring several points lower on average on DI than on Quant or Verbal and completing the section with less time to spare. - Jun 10
06:00 AM PDT
-06:15 PM PDT
Register for the GMAT Club Virtual MBA Spotlight Fair – the world’s premier event for serious MBA candidates. This is your chance to hear directly from Admissions Directors at nearly every Top 30 MBA program..


Dropdown 1: 81-90
Dropdown 2: 300%
Be sure to select an answer first to save it in the Error Log before revealing the correct answer (OA)!
Difficulty:
 35%
(medium)
35%
(medium)
Question Stats:
77% (01:26) correct 23%
(01:47)
wrong
based on 728
sessions
23%
(01:47)
wrong
based on 728
sessions
History
Date
Time
Result
Not Attempted Yet
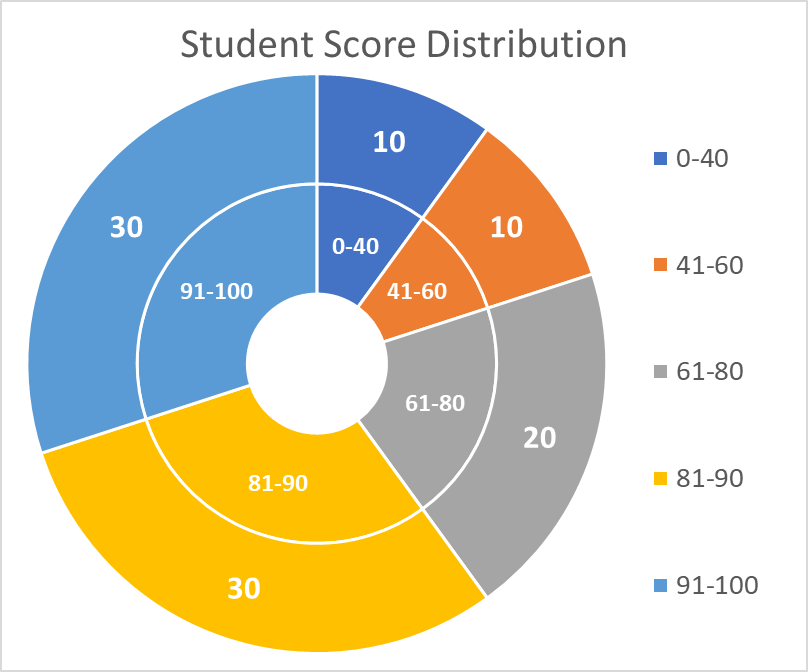
The chart shows the distribution of scores for a class of 100 students. The inner ring shows score ranges, and the outer ring shows the number of students who scored within each corresponding range.
From each drop-down menu, select the option that creates the most accurate statement based on the information provided.
The median score of the class was in the range , which had a student count equal to of that in the range 41–60.
Attachment:
Graph-GC2.png [ 220.32 KiB | Viewed 6815 times ]
ShowHide Answer
Official Answer
Dropdown 1: 81-90
Dropdown 2: 300%
Kudos
Bookmarks
Official Solution:
Drop-down 1:
The median score of the class is the middle score when all scores are arranged from lowest to highest. Since there are 100 students, the median is the average of the 50th and 51st scores.
The chart shows score ranges (segments) in increasing order, starting from the lowest (0–40) at the 12 o’clock position and moving clockwise. Each segment reflects the number of students in that range, with longer segments representing more students. The 6 o’clock position marks the halfway point in the distribution, so the segment that crosses it contains the 50th and 51st students. That means the median falls in the segment positioned at 6 o’clock.
This segment is labeled 81–90, so the median score lies in the 81–90 range.
Drop-down 2:
The 81–90 range contains 30 students, while the 41–60 range contains only 10. So the student count in 81–90 is 300%of that in 41–60.
Correct answer:
Dropdown 1: "81-90"
Dropdown 2: "300%"
Bunuel
Drop-down 1:
The median score of the class is the middle score when all scores are arranged from lowest to highest. Since there are 100 students, the median is the average of the 50th and 51st scores.
The chart shows score ranges (segments) in increasing order, starting from the lowest (0–40) at the 12 o’clock position and moving clockwise. Each segment reflects the number of students in that range, with longer segments representing more students. The 6 o’clock position marks the halfway point in the distribution, so the segment that crosses it contains the 50th and 51st students. That means the median falls in the segment positioned at 6 o’clock.
This segment is labeled 81–90, so the median score lies in the 81–90 range.
Drop-down 2:
The 81–90 range contains 30 students, while the 41–60 range contains only 10. So the student count in 81–90 is 300%of that in 41–60.
Correct answer:
Dropdown 1: "81-90"
Dropdown 2: "300%"
General Discussion


Kudos
Bookmarks
chetan2u
Number Accumulative
91-100: 30
81-90: 30 60
...
The median must be avg of 50th and 51th => in the 81-90 range
81-90: 30 students
41-60: 10 students
\(\frac{81-90-range}{41-60-range} = \frac{30}{10} = 3 = 300\)%