Events & Promotions
|
|

GMAT Club Daily Prep
Thank you for using the timer - this advanced tool can estimate your performance and suggest more practice questions. We have subscribed you to Daily Prep Questions via email.
Customized
for You
Track
Your Progress
Practice
Pays
Not interested in getting valuable practice questions and articles delivered to your email? No problem, unsubscribe here.
- Nov 19
12:30 PM EST
-01:30 PM EST
Learn how Keshav, a Chartered Accountant, scored an impressive 705 on GMAT in just 30 days with GMATWhiz's expert guidance. In this video, he shares preparation tips and strategies that worked for him, including the mock, time management, and more - Nov 18
11:00 AM PST
-12:00 PM PST
Join us in a live GMAT practice session and solve 30 challenging GMAT questions with other test takers in timed conditions, covering GMAT Quant, Data Sufficiency, Data Insights, Reading Comprehension, and Critical Reasoning questions. - Nov 20
01:30 PM EST
-02:30 PM IST
Learn how Kamakshi achieved a GMAT 675 with an impressive 96th %ile in Data Insights. Discover the unique methods and exam strategies that helped her excel in DI along with other sections for a balanced and high score. - Nov 22
11:00 AM IST
-01:00 PM IST
Do RC/MSR passages scare you? e-GMAT is conducting a masterclass to help you learn – Learn effective reading strategies Tackle difficult RC & MSR with confidence Excel in timed test environment - Nov 23
11:00 AM IST
-01:00 PM IST
Attend this free GMAT Algebra Webinar and learn how to master the most challenging Inequalities and Absolute Value problems with ease. - Nov 24
07:00 PM PST
-08:00 PM PST
Full-length FE mock with insightful analytics, weakness diagnosis, and video explanations! - Nov 25
10:00 AM EST
-11:00 AM EST
Prefer video-based learning? The Target Test Prep OnDemand course is a one-of-a-kind video masterclass featuring 400 hours of lecture-style teaching by Scott Woodbury-Stewart, founder of Target Test Prep and one of the most accomplished GMAT instructors.
Kudos
Bookmarks
According to the forecasts, the team with the median sales in Q1 will also have the median sales in Q2.: False
Of the teams that are projected to see a quarterly increase in Q3, more than half are expected to see an additional quarterly increase in Q4.: True
The number of teams projected to see a quarterly decrease in both Q2 and Q3 is greater than the number of teams projected to see a quarterly decrease in both Q3 and Q4.: False
Be sure to select an answer first to save it in the Error Log before revealing the correct answer (OA)!
Difficulty:
 55%
(hard)
Question Stats:
76% (02:57) correct 24%
(03:04)
wrong
  based on 990
sessions
History
Date
Time
Result
Not Attempted Yet
The table presents the Q1 medical equipment sales figures for 9 regional sales teams and the forecasted changes in sales for each quarter (relative to the prior quarter). Q1 figures are in thousands of dollars.
Forecast
(Sort ↕ the table by clicking on the headers)
For each of the following statements, select True if the statement can be shown to be true using the information provided. Otherwise, select False.
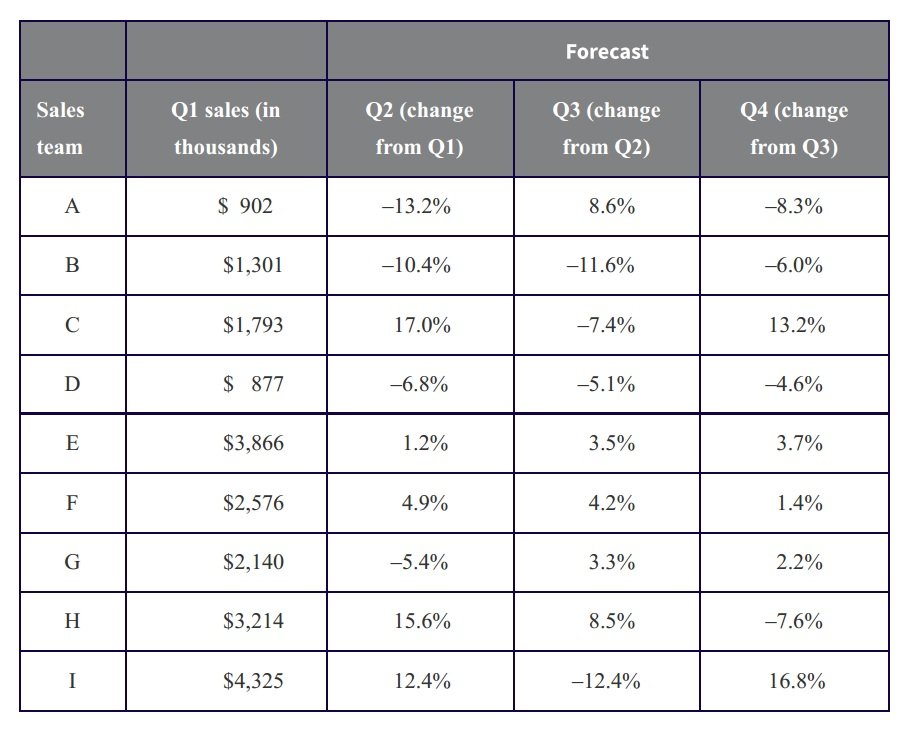
Table 1.jpg [ 116.61 KiB | Viewed 13404 times ]
Forecast
| Sales Teams | Q1 Sales (in Thousand $) | Q2 Change from Q1 (%) | Q3 Change from Q2 (%) | Q4 Change from Q3 (%) |
|---|---|---|---|---|
| A | 902 | —13.2% | 8.6% | -8.3% |
| B | 1301 | —10.4% | —11.6% | —6.0% |
| C | 1793 | 17% | —7.4% | 13.2% |
| D | 877 | —6.8% | —5.1% | —4.6% |
| E | 3866 | 1.2% | 3.5% | 3.7% |
| F | 2576 | 4.9% | 4.2% | 1.4% |
| G | 2140 | —5.4% | 3.3% | 2.2% |
| H | 3214 | 15.6% | 8.5% | —7.6% |
| I | 4325 | 12.4% | —12.4% | 16.8% |
For each of the following statements, select True if the statement can be shown to be true using the information provided. Otherwise, select False.
Attachment:
Table 1.jpg [ 116.61 KiB | Viewed 13404 times ]
| True | False | |
| According to the forecasts, the team with the median sales in Q1 will also have the median sales in Q2. | ||
| Of the teams that are projected to see a quarterly increase in Q3, more than half are expected to see an additional quarterly increase in Q4. | ||
| The number of teams projected to see a quarterly decrease in both Q2 and Q3 is greater than the number of teams projected to see a quarterly decrease in both Q3 and Q4. |
ShowHide Answer
Official Answer
According to the forecasts, the team with the median sales in Q1 will also have the median sales in Q2.: False
Of the teams that are projected to see a quarterly increase in Q3, more than half are expected to see an additional quarterly increase in Q4.: True
The number of teams projected to see a quarterly decrease in both Q2 and Q3 is greater than the number of teams projected to see a quarterly decrease in both Q3 and Q4.: False
Kudos
Bookmarks
Official Explanation
Step 1: Understand the Prompt and Question
First Statement
According to the forecasts, the team with the median sales in Q1 will also have the median sales in Q2
The statement says that the same team has the median sales in both Q1 and Q2. Glance back up at the blurb; how many sales teams are there? Nine. (You don’t have to count—the blurb says that there are nine teams. Always check the blurb first before you try to count the total number of rows; if it’s a longer table, chances are the blurb will tell you.)
Step 2: Plan Your Approach
To find the median, the numbers have to be listed in order, so you’re definitely going to sort this thing. Finding the median for Q1 will be easy, since the Q1 column shows the actual sales figures.
Q2, though, is trickier, as it shows only the percentage increase or decrease from Q1. You do have a calculator, so maybe you just have to calculate the forecasted sales for each sales team in Q2? There are nine rows. That’s a lot of work. So stop! Don’t do annoying math. This is why you Plan before you Solve.
First, sort by Q1 sales to find that median, then examine the data to think about the best approach for the Q2 data.
Step 3: Solve the problem
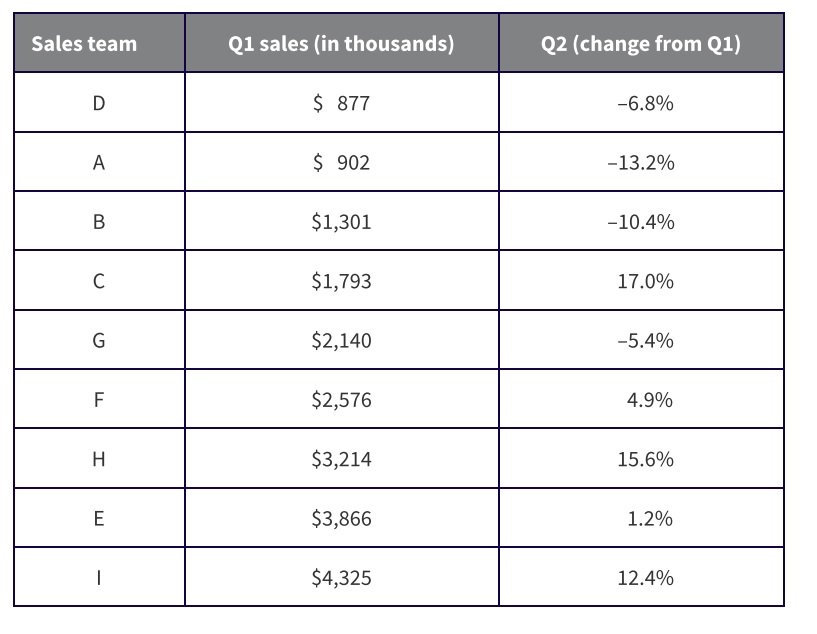
Here’s the table sorted by Q1 (and without Q3 or Q4, since they don’t matter for this statement):
2.jpg [ 72.71 KiB | Viewed 13996 times ]
The median for Q1 is the fifth one from the top or the bottom: Team G. Go back to your Plan stage for a minute and remind yourself of the question: Does Team G have the median for both Q1 and Q2? In other words, does Team G stay in the fifth position or does its position change? Team G’s sales will decrease a little bit, but not that much—a little over 5%. The numbers for each team are far enough apart that you can use benchmarks to estimate the change:
10% of $2,140 = $214
Half of that = 5% = $107
$2,140 – $107 ≈ $2,000
Next, eyeball the data to see which other teams might change positions relative to Team G. (To eyeball is to look and think logically about the data; you won’t be doing any actual calculations, even at an estimation level.)
Teams D, A, and B are already below $2,000 in Q1 and they all decrease further, so they will still stay below Team G in the Q2 list. No need to calculate anything for them.
Team C, by contrast, increases, so it could jump past Team G. You might have to do some calculations, so jot down Team C on your scratch paper as a reminder. Next, take a look at the teams that have Q1 sales greater than those of Team G. They are already higher than $2,000 and all four increase in Q2, so they will stay above Team G in that quarter.
The only possibility is that Team C will swap places with Team G. Eyeballing the data saves a lot of time that would have been wasted with unnecessary calculations! Jot down the numbers you need, then figure out how to do the calculations.
Finally, plug the calculations into your calculator to solve:

1.jpg [ 38.06 KiB | Viewed 13427 times ]
Team C does indeed pass Team G in Q2, so Team C is now the team with the median sales volume. Is it not true that the same team is in the median position for both quarters.
The correct answer for statement 1 is False.
Here is statement 2:
Of the teams that are projected to see a quarterly increase in Q3, more than half are expected to see an additional quarterly increase in Q4.
The statement says that the same team has the median sales in both Q1 and Q2.
This time, the statement focuses on Q3 and Q4. When you see something like of the teams that (fall into a certain category), the statement is giving you a qualifier: It wants you to consider only a subset of the categories given in the table.
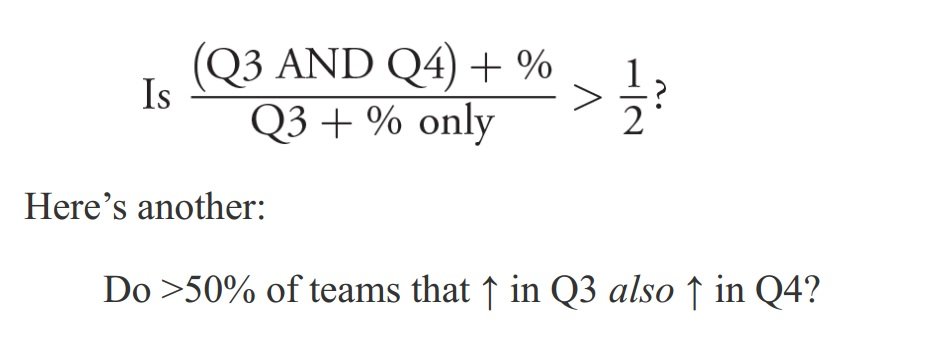
In this case, the desired subset is those teams that will have a Q3 increase. You don’t technically have to sort in order to see which teams have positive percentages in Q3, but do so anyway. Sorting by Q3 will group those teams together so that you don’t inadvertently include teams that you don’t want. Before you do that, though, jot down what the statement wants you to find.
Here’s one way to do that:
4.jpg [ 39.82 KiB | Viewed 13306 times ]
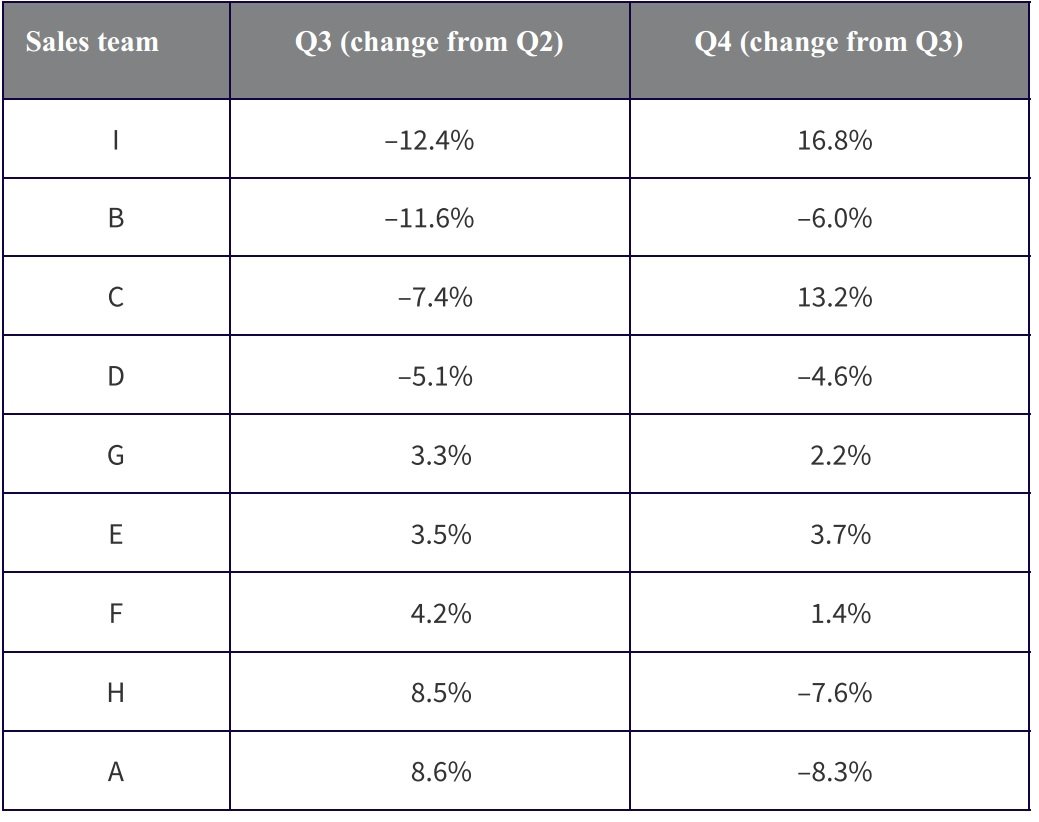
Note it in any way that makes sense to you. Here’s the data sorted by the Q3 column:
5.jpg [ 95.83 KiB | Viewed 13290 times ]
Only five of the teams will have a quarterly increase in Q3: Teams G, E, F, H, and A. Of just those teams, three also have an increase in Q4: Teams G, E, and F.
Therefore, three out of five of the teams increase in both quarters. This is greater than 50%, so this statement is true.
The correct answer for statement 2 is True.
Here is the third statement:
The number of teams projected to see a quarterly decrease in both Q2 and Q3 is greater than the number of teams projected to see a quarterly decrease in both Q3 and Q4
This is very similar to statement 2: You’re looking for two adjacent quarters with the same trend. You have to do it for two groupings this time, not just one. Jot this down in a form that makes sense for you; here’s one way to do that:
Is # (Q2 and Q3) ↓ more than # (Q3 and Q4) ↓ ?
Make sure to evaluate each part separately so that you don’t, for example, mistakenly carry over Q2 data into the examination of Q3 and Q4. And you’ll again minimize your chances of a careless error if you sort as you go.
First, sort by Q2:
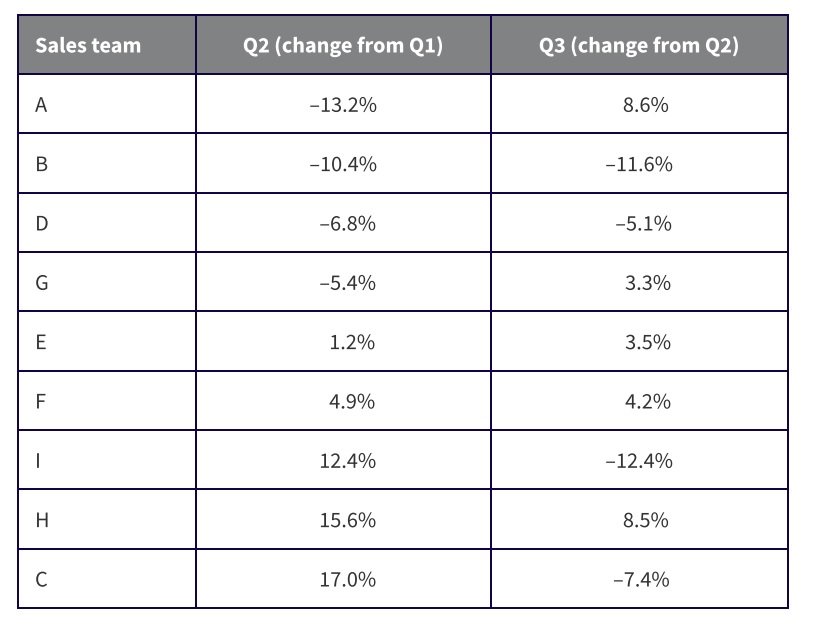
6.jpg [ 67.48 KiB | Viewed 13108 times ]
Two teams are projected to have a decrease in both Q2 and Q3: Teams B and D.
Next, sort by Q3:
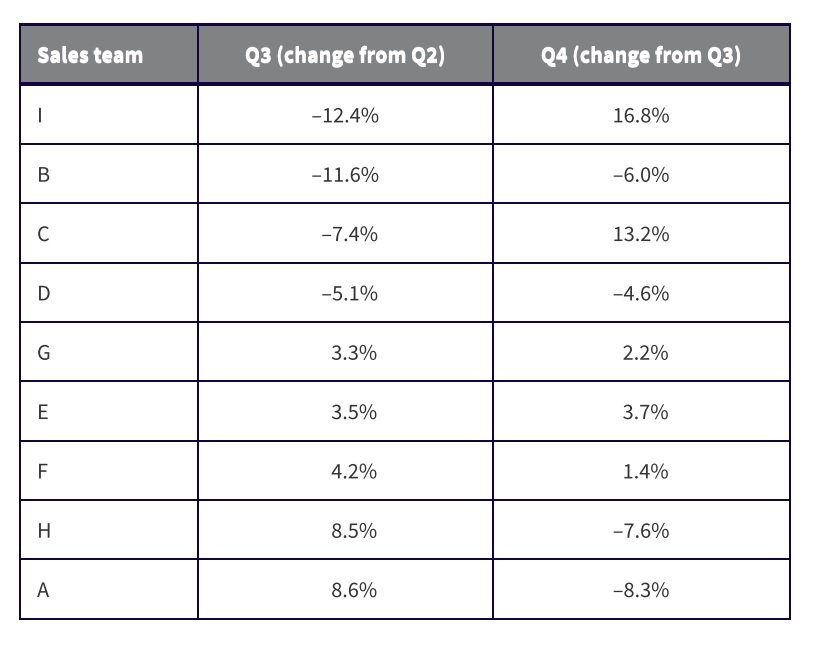
7.jpg [ 71.4 KiB | Viewed 13049 times ]
Again, two teams are projected to have a decrease in both Q3 and Q4; Teams B and D again.
It is not the case that the number of teams with decreased sales in both Q2 and Q3 is greater than that in both Q3 and Q4.
The correct answer for statement 3 is False.
Step 1: Understand the Prompt and Question
First Statement
According to the forecasts, the team with the median sales in Q1 will also have the median sales in Q2
The statement says that the same team has the median sales in both Q1 and Q2. Glance back up at the blurb; how many sales teams are there? Nine. (You don’t have to count—the blurb says that there are nine teams. Always check the blurb first before you try to count the total number of rows; if it’s a longer table, chances are the blurb will tell you.)
Step 2: Plan Your Approach
To find the median, the numbers have to be listed in order, so you’re definitely going to sort this thing. Finding the median for Q1 will be easy, since the Q1 column shows the actual sales figures.
Q2, though, is trickier, as it shows only the percentage increase or decrease from Q1. You do have a calculator, so maybe you just have to calculate the forecasted sales for each sales team in Q2? There are nine rows. That’s a lot of work. So stop! Don’t do annoying math. This is why you Plan before you Solve.
First, sort by Q1 sales to find that median, then examine the data to think about the best approach for the Q2 data.
Step 3: Solve the problem
Here’s the table sorted by Q1 (and without Q3 or Q4, since they don’t matter for this statement):
Attachment:
2.jpg [ 72.71 KiB | Viewed 13996 times ]
The median for Q1 is the fifth one from the top or the bottom: Team G. Go back to your Plan stage for a minute and remind yourself of the question: Does Team G have the median for both Q1 and Q2? In other words, does Team G stay in the fifth position or does its position change? Team G’s sales will decrease a little bit, but not that much—a little over 5%. The numbers for each team are far enough apart that you can use benchmarks to estimate the change:
10% of $2,140 = $214
Half of that = 5% = $107
$2,140 – $107 ≈ $2,000
Next, eyeball the data to see which other teams might change positions relative to Team G. (To eyeball is to look and think logically about the data; you won’t be doing any actual calculations, even at an estimation level.)
Teams D, A, and B are already below $2,000 in Q1 and they all decrease further, so they will still stay below Team G in the Q2 list. No need to calculate anything for them.
Team C, by contrast, increases, so it could jump past Team G. You might have to do some calculations, so jot down Team C on your scratch paper as a reminder. Next, take a look at the teams that have Q1 sales greater than those of Team G. They are already higher than $2,000 and all four increase in Q2, so they will stay above Team G in that quarter.
The only possibility is that Team C will swap places with Team G. Eyeballing the data saves a lot of time that would have been wasted with unnecessary calculations! Jot down the numbers you need, then figure out how to do the calculations.
Finally, plug the calculations into your calculator to solve:
Attachment:
1.jpg [ 38.06 KiB | Viewed 13427 times ]
Team C does indeed pass Team G in Q2, so Team C is now the team with the median sales volume. Is it not true that the same team is in the median position for both quarters.
The correct answer for statement 1 is False.
Here is statement 2:
Of the teams that are projected to see a quarterly increase in Q3, more than half are expected to see an additional quarterly increase in Q4.
The statement says that the same team has the median sales in both Q1 and Q2.
This time, the statement focuses on Q3 and Q4. When you see something like of the teams that (fall into a certain category), the statement is giving you a qualifier: It wants you to consider only a subset of the categories given in the table.
In this case, the desired subset is those teams that will have a Q3 increase. You don’t technically have to sort in order to see which teams have positive percentages in Q3, but do so anyway. Sorting by Q3 will group those teams together so that you don’t inadvertently include teams that you don’t want. Before you do that, though, jot down what the statement wants you to find.
Here’s one way to do that:
Attachment:
4.jpg [ 39.82 KiB | Viewed 13306 times ]
Note it in any way that makes sense to you. Here’s the data sorted by the Q3 column:
Attachment:
5.jpg [ 95.83 KiB | Viewed 13290 times ]
Only five of the teams will have a quarterly increase in Q3: Teams G, E, F, H, and A. Of just those teams, three also have an increase in Q4: Teams G, E, and F.
Therefore, three out of five of the teams increase in both quarters. This is greater than 50%, so this statement is true.
The correct answer for statement 2 is True.
Here is the third statement:
The number of teams projected to see a quarterly decrease in both Q2 and Q3 is greater than the number of teams projected to see a quarterly decrease in both Q3 and Q4
This is very similar to statement 2: You’re looking for two adjacent quarters with the same trend. You have to do it for two groupings this time, not just one. Jot this down in a form that makes sense for you; here’s one way to do that:
Is # (Q2 and Q3) ↓ more than # (Q3 and Q4) ↓ ?
Make sure to evaluate each part separately so that you don’t, for example, mistakenly carry over Q2 data into the examination of Q3 and Q4. And you’ll again minimize your chances of a careless error if you sort as you go.
First, sort by Q2:
Attachment:
6.jpg [ 67.48 KiB | Viewed 13108 times ]
Two teams are projected to have a decrease in both Q2 and Q3: Teams B and D.
Next, sort by Q3:
Attachment:
7.jpg [ 71.4 KiB | Viewed 13049 times ]
Again, two teams are projected to have a decrease in both Q3 and Q4; Teams B and D again.
It is not the case that the number of teams with decreased sales in both Q2 and Q3 is greater than that in both Q3 and Q4.
The correct answer for statement 3 is False.
General Discussion
[quote="Sajjad1994"]The table presents the Q1 medical equipment sales figures for 9 regional sales teams and the forecasted changes in sales for each quarter (relative to the prior quarter). Q1 figures are in thousands of dollars.
For each of the following statements, select True if the statement can be shown to be true using the information provided. Otherwise, select False.
1. The sequence of teams acoording to Q1 sales:
D, A, B, C, G, F, H, E, I
The team with median sale: G
For Q2, A, B, D are projected negative growth and F, H, E, and I are projected positive growth. So no need to check for them as A, B, and D will acquire first, second, third positions and F, H, E, and I will acquire last positions.
Sales in Q2:
For C = 1793+17% = 2097.81
For G = 2140 - 5.4% = 2024.44
So, in Q2, C will be median.
The answer is FALSE.
2. Of the teams that are projected to see a quarterly increase in Q3 = A, E, F, G, H i. e. total 5 in number
more than half are expected to see an additional quarterly increase in Q4 = F, G, H i. e. total 3 in number
3/5 is greater than half.
Answer is TRUE.
3. The number of teams projected to see a quarterly decrease in both Q2 and Q3 = B and D i. e. 2 in number
is greater than the number of teams projected to see a quarterly decrease in both Q3 and Q4. = B and D i. e. 2 in number
But 2 is not greater than 2
So, the answer is FALSE
Attachment:
Table 1.jpg
For each of the following statements, select True if the statement can be shown to be true using the information provided. Otherwise, select False.
| True........... | False............. | |
| According to the forecasts, the team with the median sales in Q1 will also have the median sales in Q2. | ||
| Of the teams that are projected to see a quarterly increase in Q3, more than half are expected to see an additional quarterly increase in Q4. | ||
| The number of teams projected to see a quarterly decrease in both Q2 and Q3 is greater than the number of teams projected to see a quarterly decrease in both Q3 and Q4. |
1. The sequence of teams acoording to Q1 sales:
D, A, B, C, G, F, H, E, I
The team with median sale: G
For Q2, A, B, D are projected negative growth and F, H, E, and I are projected positive growth. So no need to check for them as A, B, and D will acquire first, second, third positions and F, H, E, and I will acquire last positions.
Sales in Q2:
For C = 1793+17% = 2097.81
For G = 2140 - 5.4% = 2024.44
So, in Q2, C will be median.
The answer is FALSE.
2. Of the teams that are projected to see a quarterly increase in Q3 = A, E, F, G, H i. e. total 5 in number
more than half are expected to see an additional quarterly increase in Q4 = F, G, H i. e. total 3 in number
3/5 is greater than half.
Answer is TRUE.
3. The number of teams projected to see a quarterly decrease in both Q2 and Q3 = B and D i. e. 2 in number
is greater than the number of teams projected to see a quarterly decrease in both Q3 and Q4. = B and D i. e. 2 in number
But 2 is not greater than 2
So, the answer is FALSE


