Events & Promotions
|
|

GMAT Club Daily Prep
Thank you for using the timer - this advanced tool can estimate your performance and suggest more practice questions. We have subscribed you to Daily Prep Questions via email.
Customized
for You
Track
Your Progress
Practice
Pays
Not interested in getting valuable practice questions and articles delivered to your email? No problem, unsubscribe here.
 Jun 10
06:00 AM PDT
-06:15 PM PDT
Register for the GMAT Club Virtual MBA Spotlight Fair – the world’s premier event for serious MBA candidates. This is your chance to hear directly from Admissions Directors at nearly every Top 30 MBA program..

pria131

Joined: 25 Jan 2015
Last visit: 29 Aug 2017
Posts: 95
Given Kudos: 109
Location: United States
Concentration: Marketing, General Management
Schools: Kenan-Flagler '18 (WL) Olin '18 (A) NUS '18 (D) Tuck '18 (D) HEC Dec '17 (D) INSEAD Jan '17 Oxford'17 (A)
GMAT 1: 720 Q50 V38
WE:Business Development (Computer Software)
Products:
Schools: Kenan-Flagler '18 (WL) Olin '18 (A) NUS '18 (D) Tuck '18 (D) HEC Dec '17 (D) INSEAD Jan '17 Oxford'17 (A)
GMAT 1: 720 Q50 V38
Posts: 95
Kudos
Bookmarks
Archived 'Calling All INSEAD Applicants' Topic
Hi there,
You've reached an old 'Calling All INSEAD Applicants' discussion which is now
outdated and has been archived. No more replies are possible here.
Looking for the latest discussion? Check out this up-to-date Calling All INSEAD Applicants
Discussion
for the most recent conversations on this topic.
Interested in more from this school? Visit our dedicated
INSEAD Forum
to dive into all things related to INSEAD's MBA program.
Thank you for understanding, and happy exploring!

Kudos
Bookmarks
INSEAD - Admission Trends Over 5 Years!!
We decided to analyse our accumulated forum data of INSEAD applicants to determine admission trends and acceptance chances of applicants. We have tried to determine acceptance chances by GMAT score, Intakes, industry, etc. and compare performance of GMAT Club applicants with overall applicant pool. The data used for this analysis is self-reported, so it's advised to use findings of this analysis only to get idea of admission scenario at INSEAD. Don't presume that these findings will hold true all the time.
We would welcome any comments, opinions, suggestions or anything else that you might have to say about the findings of this analysis.
| INSEAD vs GMATClub Applicant Pool: YoY Comparison | ||||||||||
| 2012 Intake | 2013 Intake | 2014 Intake | 2015 Intake | 2016 Intake | ||||||
School | GMAT Club | School | GMAT Club | School | GMAT Club | School | GMAT Club | School | GMAT Club | |
| Acceptance Rate | N/A | 37% | N/A | 27% | N/A | 26% | N/A | 25% | N/A | 18% |
| Average GMAT | N/A | 724 | N/A | 710 | 701 | 710 | 700 | 708 | 700 | 709 |
| Average GPA | N/A | 3.45 | N/A | 3.49 | N/A | 3.46 | N/A | 3.5 | N/A | 3.46 |
| Avg Work Experience | 60 - 72 | 67 | 60 - 72 | 71 | 72 | 68 | 66 | 66 | 72 | 64 |
| Average Age | 29 | 29 | 29 | 29 | 29 | 28 | 29 | 28 | 29 | 28 |
January and September Intakes: Applicants and Acceptance Rates
- Both the acceptance rate and number of applicants are higher for Sept intake.
- R2 and R3 have highest probability of acceptance than other rounds.
- R1 is greatest round in terms of number of applicants.
Sample Size: 1907 Applicants


Acceptance Rate by GMAT Score
- As expected, acceptance chances increase with higher GMAT scores; however, this holds true only upto 730 level, after which we can see some decrease in the acceptance chances of applicants with GMAT scores 740 and 750. We observed similar trend during the analysis of ISB applicants as well.
Sample Size: 838 Applicants

Acceptance Rates of Different Age Groups GMAT Score
- Greatest portion of INSEAD's applicant pool is coming from 28-30 age group and this group also has highest chance of admission. This is not very surprising because average age of INSEAD's incoming class has always stayed around 28 - 29.
Sample Size: 358 Applicants

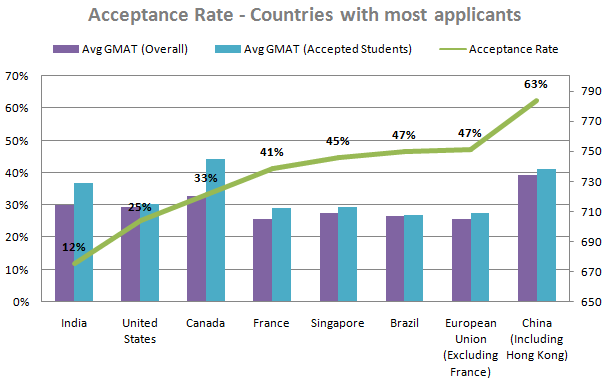
Acceptance rates by Countries
- For this analysis, we have considered only those countries that have relatively higher number of INSEAD applicants on forum. We have not chosen the countries with less than 15 applicants.
- We have also shown the difference between average GMAT of overall applicant pool of a specific country and average GMAT of admitted students of that country.
Sample Size: 610 Applicants
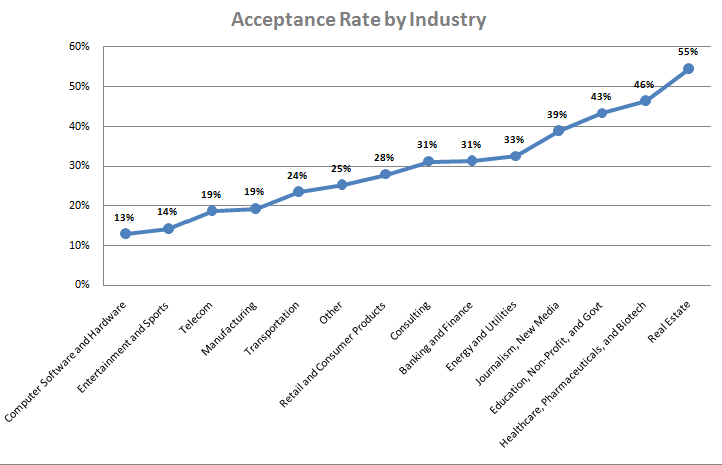
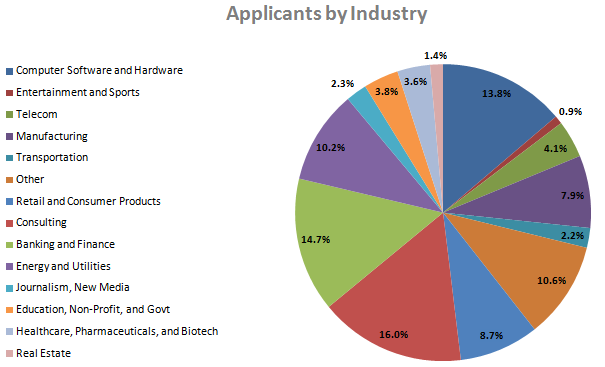
Acceptance rates of applicants from various industries
- The first chart - line chart - shows acceptance rates of applicants from various industries and the pie chart next to it shows industri-wise allocation of applicants.
Sample Size: 784 Applicants
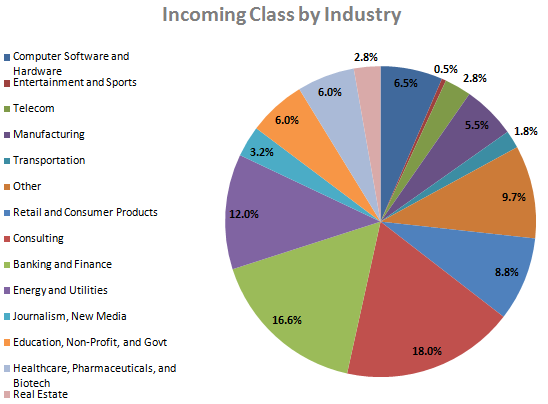
Incoming Class of INSEAD
- Here we have done industry-wise classification of students admitted between 2012 and 2016 to see representation of various industries in an average INSEAD MBA class.
Sample Size: 784 Applicants
As I said earlier, we welcome your views, counterviews, suggestions, etc on the analysis. Thank you!
hashimmuntazar
Joined: 21 Jun 2014
Last visit: 04 Aug 2016
Posts: 4
Given Kudos: 1
Concentration: Technology, Entrepreneurship
Schools: INSEAD Jan '17
GMAT 1: 690 Q41 V38
GPA: 2.97
WE:Information Technology (Other)
Kudos
Bookmarks
Thank you for setting this up, Narenn. I'm applying for the Jan '17 intake and am looking forward to interacting with my fellow applicants!


