Events & Promotions
|
|

GMAT Club Daily Prep
Thank you for using the timer - this advanced tool can estimate your performance and suggest more practice questions. We have subscribed you to Daily Prep Questions via email.
Customized
for You
Track
Your Progress
Practice
Pays
Not interested in getting valuable practice questions and articles delivered to your email? No problem, unsubscribe here.
 Sep 06
09:30 AM EDT
-12:30 PM EST
Top scores are possible when you enroll in a powerful EA course, taught live online + 6 months access to TTP OnDemand video courses included! Perfect class schedule and easy course access for working professionals. Class starts Sundays Sept. 6, 2026. Sep 02
01:00 PM EDT
-11:59 PM EDT
Take 30% off all study plans with code COURSEWORK - Expires on Monday 9/7 Sep 04
01:30 AM EDT
-02:30 AM EDT
This Labor Day, turn your hard work into real score gains. From 615→715 in 15 days to 705 in 30 days, our students prove what's possible with personalized, expert guidance. Save up to 25% on 1-on-1 tutoring. Sep 04
10:00 AM EDT
-11:59 PM EDT
We’ve worked incredibly hard to build TTP into the best test prep experience possible, and it would mean a lot to us to win Newsweek’s 2026 Readers’ Choice Award for Best Test Prep. If TTP has helped you, we’d be incredibly grateful for your vote. Sep 07
12:01 AM PDT
-11:59 PM PDT
On the 7th, GMAT Club Tests will be Free! Including all the Quizzes, Questions, and Tests. 12 AM - 11:59 PM PDT Sep 07
12:30 AM EDT
-01:30 AM EDT
Tejas studied hard but kept repeating the same mistakes. After 3 attempts at 645, a focused 4-week strategy helped him identify and fix what was holding him back—leading to a 695 with just 12–15 hours of study per week.- Sep 07
10:00 AM PDT
-11:00 AM PDT
A complete walkthrough of GMAT Club’s free 12-week GMAT study plan: what you study each week, how progress and goals are tracked, how the error log works, and how your practice unlocks paid tools at no cost. - Sep 09
07:00 AM PDT
-10:00 AM PDT
Meet AdComs and explore top Master’s programs - MiM, MiF, MSc, MSBA and more. - Application Fee Waivers - Free 1-Week of GMAT Club Tests: - Master's Application Toolkit - Grand Prize Giveaway - Sep 09
10:00 AM PDT
-11:00 AM PDT
Three MBA applications. Three rejections. No interview invites. A year later, Aman was admitted to Cambridge Judge, SMU, and IMD. In this episode of MBA Admit Stories, Aman shares how he rebuilt his MBA application...  Sep 10
08:00 PM PDT
-09:00 PM PDT
Free- full-length test + 15 concept videos + 150+ short videos + study plan! Sep 15
07:00 PM EDT
-09:00 PM EST
Elite scores are possible when you enroll in a powerful GMAT course, taught live online + 6 months access to TTP OnDemand video courses included! Class starts Tues/Thurs Sept. 15, 2026 - Nov. 15, 2027, 7:00pm-9:00pm EST Sep 21
08:00 PM EDT
-10:00 PM EDT
Boost your GMAT score in less than one month in a live online class + 6 months access to TTP OnDemand video courses included! Class starts Mon, Tues, Wed, Thur, Fri Sept. 21, 2026 - Oct. 9, 2027, 7:00pm-10:00pm EST

 11 May 2020, 00:44
Kudos
Bookmarks


Each of the populations that depend on both farming and wage work is sedentary and has a mean community size among the five largest.: Yes
The populations that forage have the lowest market integration ratings.: Yes
The range for market integration is less than the range for participation in world religions.: Yes
Be sure to select an answer first to save it in the Error Log before revealing the correct answer (OA)!
Difficulty:
 25%
(medium)
25%
(medium)
Question Stats:
84% (02:33) correct 16%
(02:40)
wrong
based on 1366
sessions
16%
(02:40)
wrong
based on 1366
sessions
History
Date
Time
Result
Not Attempted Yet
| Population | Location | Economic base | Residence | Mean MI | Mean WR | Mean CS |
|---|---|---|---|---|---|---|
| Au | Papua New Guinea | horticulture, foraging | sedentary | 1 | 100 | 309 |
| Dolgan/NG | Siberia | hunting, fishing, and wage work | semi-sedentary | 63 | 59 | 612 |
| Gusii | Kenya | farming and wage work | sedentary | 28 | 100 | 4063 |
| Hadza | Tanzania | foraging | nomadic | 0 | 0 | 43 |
| Isanga village | Tanzania | farming and wage work | sedentary | 70 | 99 | 1500 |
| Maragoli | Kenya | farming and wage work | sedentary | 43 | 100 | 3843 |
| Orma | Kenya | herding livestock | semi-nomadic | 72 | 100 | 125 |
| Samburu | Kenya | herding livestock | semi-nomadic | 69 | 66 | 2000 |
| Sanquianga | Colombia | fisheries | I sedentary | 82 | 84 | 1931 |
| Shuar | Ecuador | horticulture | sedentary | 22 | 76 | 498 |
| Sursurunga | Papua New Guinea | horticulture | sedentary | 24 | 100 | 186 |
| Tsimane | Bolivia | horticulture, foraging | semi-nomadic | 7 | 100 | 314 |
| Yasawa | Fiji | horticulture, marine foraging | sedentary | 21 | 100 | 109 |
Anthropologists collected data about cultural patterns and norms for several small indigenous populations in various countries. The table displays data collected about the economic base; residential patterns (residence); degree of market integration (mean MI)—defined as the percentage of calories obtained in the marketplace; percentage of population participating in world religions (mean WR); and average community size (mean CS).
For each of the following statements about these indigenous populations, select Yes if the statement accurately reflects the data provided in the table. Otherwise, select No.
| Yes | No | |
| Each of the populations that depend on both farming and wage work is sedentary and has a mean community size among the five largest. | ||
| The populations that forage have the lowest market integration ratings. | ||
| The range for market integration is less than the range for participation in world religions. |
ShowHide Answer
Official Answer
Each of the populations that depend on both farming and wage work is sedentary and has a mean community size among the five largest.: Yes
The populations that forage have the lowest market integration ratings.: Yes
The range for market integration is less than the range for participation in world religions.: Yes
If this question felt shaky,
try an adaptive mini quiz of similar problems in
GMAT Club Forum Quiz →. Free plan gives 5 questions per day.

 23 Apr 2021, 05:24
Kudos
Bookmarks
Official Explanation
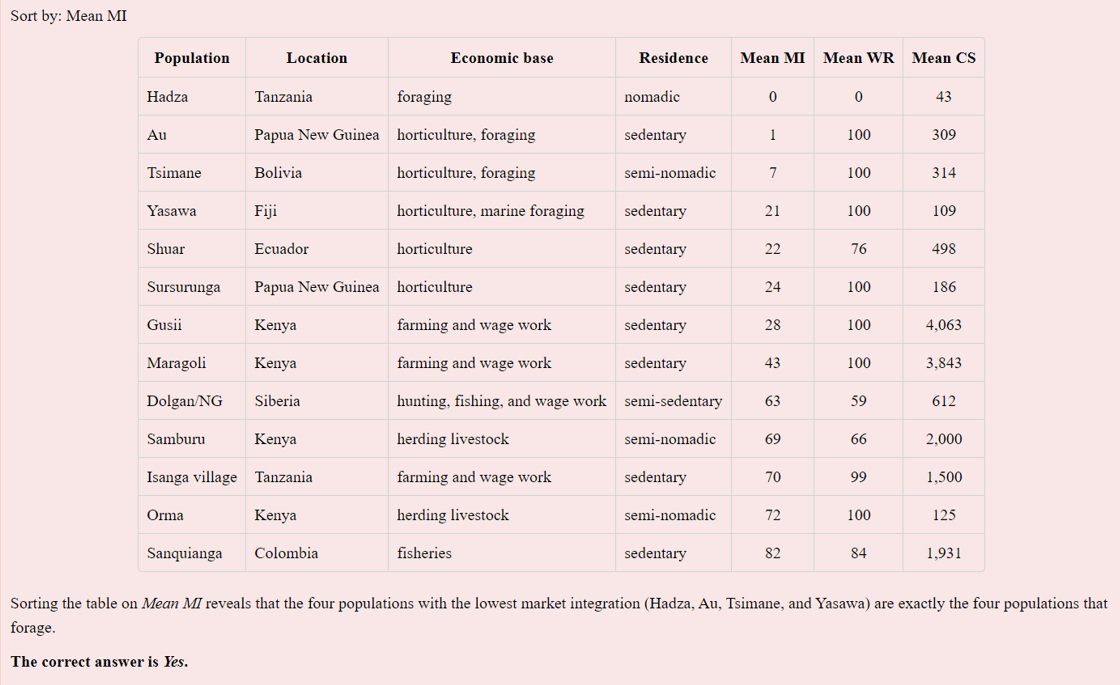
The populations that forage have the lowest market integration ratings.
1.jpg [ 148.38 KiB | Viewed 13506 times ]
Each of the populations that depend on both farming and wage work is sedentary and has a mean community size among the five largest.

2.jpg [ 148.67 KiB | Viewed 13390 times ]
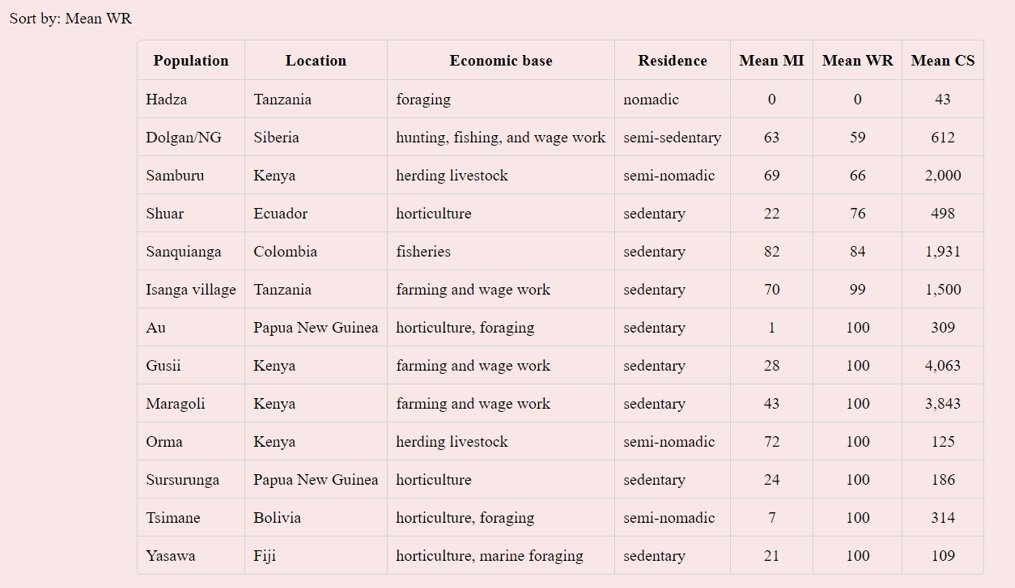
The range for market integration is less than the range for participation in world religions.
3.jpg [ 130.81 KiB | Viewed 12710 times ]
To determine the range for market integration, sort the table on Mean MI. The maximum market integration is 82 (by the Sanquianga) and the minimum market integration is 0 (by the Hadza). Therefore, the range for market integration is 82 − 0 = 82.
To determine the range for participation in world religions, examine the table sort for Mean WR. The maximum participation in world religions is 100 (by several populations) and the minimum participation in world religions is 0 (by the Hadza). Therefore, the range for participation in world religions is
100 − 0 = 100.
The range for market integration is less than the range for participation in world religions.
The correct answer is Yes.
The populations that forage have the lowest market integration ratings.
Attachment:
1.jpg [ 148.38 KiB | Viewed 13506 times ]
Each of the populations that depend on both farming and wage work is sedentary and has a mean community size among the five largest.
Attachment:
2.jpg [ 148.67 KiB | Viewed 13390 times ]
The range for market integration is less than the range for participation in world religions.
Attachment:
3.jpg [ 130.81 KiB | Viewed 12710 times ]
To determine the range for market integration, sort the table on Mean MI. The maximum market integration is 82 (by the Sanquianga) and the minimum market integration is 0 (by the Hadza). Therefore, the range for market integration is 82 − 0 = 82.
To determine the range for participation in world religions, examine the table sort for Mean WR. The maximum participation in world religions is 100 (by several populations) and the minimum participation in world religions is 0 (by the Hadza). Therefore, the range for participation in world religions is
100 − 0 = 100.
The range for market integration is less than the range for participation in world religions.
The correct answer is Yes.
General Discussion
 11 May 2020, 02:54
Kudos
Bookmarks
1)Yes,The population which forage are :
Au-1->MI rating
Hadza-0
Tsimane-7
Yasawa-21
So they all have lowest MI ratings,since the highest goes upto 72
2)Yes,Since Gusi,Isanga village,and Maragoli depend on farming and wage work and there CS rankings are:Gusi-1,Isanga village-5, Maragoli-2
3)Yes,Range for MI-72-0=72
Range for world religion=100-0=100
Posted from my mobile device
Au-1->MI rating
Hadza-0
Tsimane-7
Yasawa-21
So they all have lowest MI ratings,since the highest goes upto 72
2)Yes,Since Gusi,Isanga village,and Maragoli depend on farming and wage work and there CS rankings are:Gusi-1,Isanga village-5, Maragoli-2
3)Yes,Range for MI-72-0=72
Range for world religion=100-0=100
Posted from my mobile device