Events & Promotions
|
|

GMAT Club Daily Prep
Thank you for using the timer - this advanced tool can estimate your performance and suggest more practice questions. We have subscribed you to Daily Prep Questions via email.
Customized
for You
Track
Your Progress
Practice
Pays
Not interested in getting valuable practice questions and articles delivered to your email? No problem, unsubscribe here.
- Nov 19
12:30 PM EST
-01:30 PM EST
Learn how Keshav, a Chartered Accountant, scored an impressive 705 on GMAT in just 30 days with GMATWhiz's expert guidance. In this video, he shares preparation tips and strategies that worked for him, including the mock, time management, and more - Nov 18
11:00 AM PST
-12:00 PM PST
Join us in a live GMAT practice session and solve 30 challenging GMAT questions with other test takers in timed conditions, covering GMAT Quant, Data Sufficiency, Data Insights, Reading Comprehension, and Critical Reasoning questions. - Nov 20
01:30 PM EST
-02:30 PM IST
Learn how Kamakshi achieved a GMAT 675 with an impressive 96th %ile in Data Insights. Discover the unique methods and exam strategies that helped her excel in DI along with other sections for a balanced and high score. - Nov 22
11:00 AM IST
-01:00 PM IST
Do RC/MSR passages scare you? e-GMAT is conducting a masterclass to help you learn – Learn effective reading strategies Tackle difficult RC & MSR with confidence Excel in timed test environment - Nov 23
11:00 AM IST
-01:00 PM IST
Attend this free GMAT Algebra Webinar and learn how to master the most challenging Inequalities and Absolute Value problems with ease. - Nov 24
07:00 PM PST
-08:00 PM PST
Full-length FE mock with insightful analytics, weakness diagnosis, and video explanations! - Nov 25
10:00 AM EST
-11:00 AM EST
Prefer video-based learning? The Target Test Prep OnDemand course is a one-of-a-kind video masterclass featuring 400 hours of lecture-style teaching by Scott Woodbury-Stewart, founder of Target Test Prep and one of the most accomplished GMAT instructors.
Kudos
Bookmarks
Each of the populations that depend on both farming and wage work is sedentary and has a mean community size among the five largest.: Yes
The populations that forage have the lowest market integration ratings.: Yes
The range for market integration is less than the range for participation in world religions.: Yes
Be sure to select an answer first to save it in the Error Log before revealing the correct answer (OA)!
Difficulty:
 25%
(medium)
Question Stats:
88% (02:34) correct 12%
(02:42)
wrong
  based on 838
sessions
History
Date
Time
Result
Not Attempted Yet
| Population | Location | Economic base | Residence | Mean MI | Mean WR | Mean CS |
|---|---|---|---|---|---|---|
| Au | Papua New Guinea | horticulture, foraging | sedentary | 1 | 100 | 309 |
| Dolgan/NG | Siberia | hunting, fishing, and wage work | semi-sedentary | 63 | 59 | 612 |
| Gusii | Kenya | farming and wage work | sedentary | 28 | 100 | 4063 |
| Hadza | Tanzania | foraging | nomadic | 0 | 0 | 43 |
| Isanga village | Tanzania | farming and wage work | sedentary | 70 | 99 | 1500 |
| Maragoli | Kenya | farming and wage work | sedentary | 43 | 100 | 3843 |
| Orma | Kenya | herding livestock | semi-nomadic | 72 | 100 | 125 |
| Samburu | Kenya | herding livestock | semi-nomadic | 69 | 66 | 2000 |
| Sanquianga | Colombia | fisheries | I sedentary | 82 | 84 | 1931 |
| Shuar | Ecuador | horticulture | sedentary | 22 | 76 | 498 |
| Sursurunga | Papua New Guinea | horticulture | sedentary | 24 | 100 | 186 |
| Tsimane | Bolivia | horticulture, foraging | semi-nomadic | 7 | 100 | 314 |
| Yasawa | Fiji | horticulture, marine foraging | sedentary | 21 | 100 | 109 |
Anthropologists collected data about cultural patterns and norms for several small indigenous populations in various countries. The table displays data collected about the economic base; residential patterns (residence); degree of market integration (mean MI)—defined as the percentage of calories obtained in the marketplace; percentage of population participating in world religions (mean WR); and average community size (mean CS).
For each of the following statements about these indigenous populations, select Yes if the statement accurately reflects the data provided in the table. Otherwise, select No.
| Yes | No | |
| Each of the populations that depend on both farming and wage work is sedentary and has a mean community size among the five largest. | ||
| The populations that forage have the lowest market integration ratings. | ||
| The range for market integration is less than the range for participation in world religions. |
ShowHide Answer
Official Answer
Each of the populations that depend on both farming and wage work is sedentary and has a mean community size among the five largest.: Yes
The populations that forage have the lowest market integration ratings.: Yes
The range for market integration is less than the range for participation in world religions.: Yes
Kudos
Bookmarks
Official Explanation
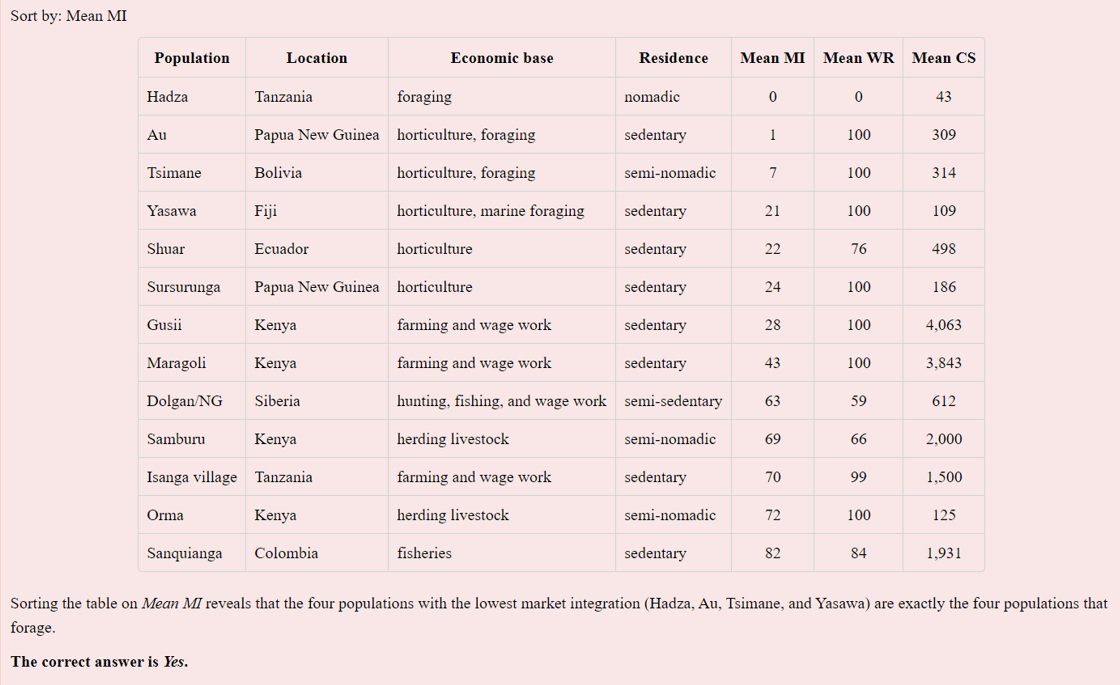
The populations that forage have the lowest market integration ratings.

1.jpg [ 148.38 KiB | Viewed 10744 times ]
Each of the populations that depend on both farming and wage work is sedentary and has a mean community size among the five largest.

2.jpg [ 148.67 KiB | Viewed 10668 times ]
The range for market integration is less than the range for participation in world religions.

3.jpg [ 130.81 KiB | Viewed 10270 times ]
To determine the range for market integration, sort the table on Mean MI. The maximum market integration is 82 (by the Sanquianga) and the minimum market integration is 0 (by the Hadza). Therefore, the range for market integration is 82 − 0 = 82.
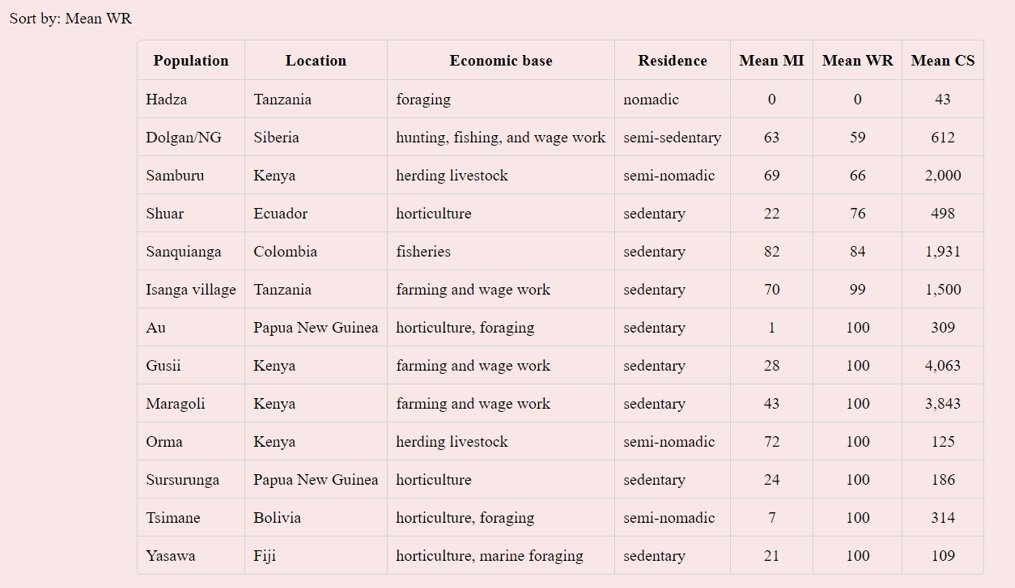
To determine the range for participation in world religions, examine the table sort for Mean WR. The maximum participation in world religions is 100 (by several populations) and the minimum participation in world religions is 0 (by the Hadza). Therefore, the range for participation in world religions is
100 − 0 = 100.
The range for market integration is less than the range for participation in world religions.
The correct answer is Yes.
The populations that forage have the lowest market integration ratings.
Attachment:
1.jpg [ 148.38 KiB | Viewed 10744 times ]
Each of the populations that depend on both farming and wage work is sedentary and has a mean community size among the five largest.
Attachment:
2.jpg [ 148.67 KiB | Viewed 10668 times ]
The range for market integration is less than the range for participation in world religions.
Attachment:
3.jpg [ 130.81 KiB | Viewed 10270 times ]
To determine the range for market integration, sort the table on Mean MI. The maximum market integration is 82 (by the Sanquianga) and the minimum market integration is 0 (by the Hadza). Therefore, the range for market integration is 82 − 0 = 82.
To determine the range for participation in world religions, examine the table sort for Mean WR. The maximum participation in world religions is 100 (by several populations) and the minimum participation in world religions is 0 (by the Hadza). Therefore, the range for participation in world religions is
100 − 0 = 100.
The range for market integration is less than the range for participation in world religions.
The correct answer is Yes.
General Discussion
Kudos
Bookmarks
1)Yes,The population which forage are :
Au-1->MI rating
Hadza-0
Tsimane-7
Yasawa-21
So they all have lowest MI ratings,since the highest goes upto 72
2)Yes,Since Gusi,Isanga village,and Maragoli depend on farming and wage work and there CS rankings are:Gusi-1,Isanga village-5, Maragoli-2
3)Yes,Range for MI-72-0=72
Range for world religion=100-0=100
Posted from my mobile device


