Events & Promotions
|
|

GMAT Club Daily Prep
Thank you for using the timer - this advanced tool can estimate your performance and suggest more practice questions. We have subscribed you to Daily Prep Questions via email.
Customized
for You
Track
Your Progress
Practice
Pays
Not interested in getting valuable practice questions and articles delivered to your email? No problem, unsubscribe here.
- Nov 20
07:30 AM PST
-08:30 AM PST
Learn what truly sets the UC Riverside MBA apart and how it helps in your professional growth - Nov 22
11:00 AM IST
-01:00 PM IST
Do RC/MSR passages scare you? e-GMAT is conducting a masterclass to help you learn – Learn effective reading strategies Tackle difficult RC & MSR with confidence Excel in timed test environment - Nov 23
11:00 AM IST
-01:00 PM IST
Attend this free GMAT Algebra Webinar and learn how to master the most challenging Inequalities and Absolute Value problems with ease. - Nov 25
10:00 AM EST
-11:00 AM EST
Prefer video-based learning? The Target Test Prep OnDemand course is a one-of-a-kind video masterclass featuring 400 hours of lecture-style teaching by Scott Woodbury-Stewart, founder of Target Test Prep and one of the most accomplished GMAT instructors.
Kudos
Bookmarks
Dropdown 1: 350 and 370
Dropdown 2: Strong Negative
Be sure to select an answer first to save it in the Error Log before revealing the correct answer (OA)!
Difficulty:
 75%
(hard)
Question Stats:
54% (02:10) correct 46%
(02:27)
wrong
  based on 3052
sessions
History
Date
Time
Result
Not Attempted Yet
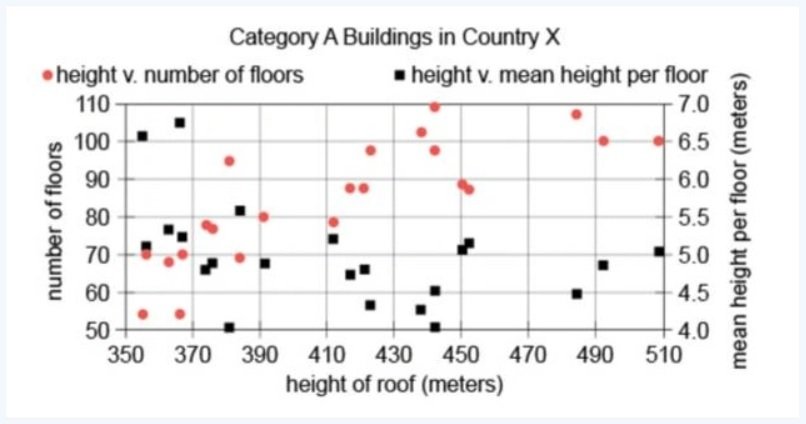
In Country X, a building is in Category A if it has a roof height of at least 350 meters. In the graph, each of the 22 Category A buildings is represented by two points arranged vertically: one representing the comparison of the height of the building’s roof to the number of floors (red circles), the other representing the comparison of the height of the building’s roof to the mean height per floor (black squares).
Based on the given information, use the drop-down menus to most accurately complete the following statements about Category A buildings in Country X.
The building with the greatest mean height per floor has a roof height between meters.
There is a correlation between the number of floors and the mean height per floor.
ID: 100408

1.jpg [ 62.44 KiB | Viewed 22486 times ]
Attachment:
1.jpg [ 62.44 KiB | Viewed 22486 times ]
Attachment:
GMAT-Club-Forum-b3ocy25y.png [ 156.6 KiB | Viewed 6730 times ]
ShowHide Answer
Official Answer
Dropdown 1: 350 and 370
Dropdown 2: Strong Negative
Kudos
Bookmarks
Official Explanation
The building with the greatest mean height per floor has a roof height between___________meters.
The building with the greatest mean height per floor is represented by the uppermost black square on the graph. The horizontal coordinate of this square indicates that the roof height of the building is between 350 and 370 meters.
The correct answer is 350 and 370.
There is a____________correlation between the number of floors and the mean height per floor.
Where the red circles are in the upper portions of the graph, the corresponding black squares are generally in the lower regions. Similarly, where the red circles are in the lower portions of the graph, the corresponding black squares are generally in the upper regions. This demonstrates a strong negative correlation between the variable represented by the vertical coordinates of the red circles and the variable represented by the vertical coordinates of the black squares. Thus there is a strong negative correlation between the number of floors and the mean height per floor.
The correct answer is strong negative.
General Discussion
Kudos
Bookmarks
The first blank is relatively easy to answer, the topmost black square lies between the points 350 and 370 on the axis representing heights of roofs.
For the second blank, one could eyeball the graph to see that as the red circles increase in height, the black squares start to descend so a strong negative correlation between the two.
Hope this helps.
For the second blank, one could eyeball the graph to see that as the red circles increase in height, the black squares start to descend so a strong negative correlation between the two.
Hope this helps.


