Events & Promotions
|
|

GMAT Club Daily Prep
Thank you for using the timer - this advanced tool can estimate your performance and suggest more practice questions. We have subscribed you to Daily Prep Questions via email.
Customized
for You
Track
Your Progress
Practice
Pays
Not interested in getting valuable practice questions and articles delivered to your email? No problem, unsubscribe here.
 May 20
08:00 AM PDT
-08:30 AM PDT
What’s in it for you- Live Profile Evaluation Chat Session with Jenifer Turtschanow, CEO, ARINGO. Come with your details prepared and ARINGO will share insights! Pre-MBA Role/Industry, YOE, Exam Score, C/GPA, ECs Post-MBA Role/ Industry & School List. Jun 10
06:00 AM PDT
-06:15 PM PDT
Register for the GMAT Club Virtual MBA Spotlight Fair – the world’s premier event for serious MBA candidates. This is your chance to hear directly from Admissions Directors at nearly every Top 30 MBA program..

Kudos
Bookmarks

Dropdown 1: 5
Dropdown 2: none
Be sure to select an answer first to save it in the Error Log before revealing the correct answer (OA)!
Difficulty:
 85%
(hard)
85%
(hard)
Question Stats:
50% (02:15) correct 50%
(02:35)
wrong
based on 2047
sessions
50%
(02:35)
wrong
based on 2047
sessions
History
Date
Time
Result
Not Attempted Yet
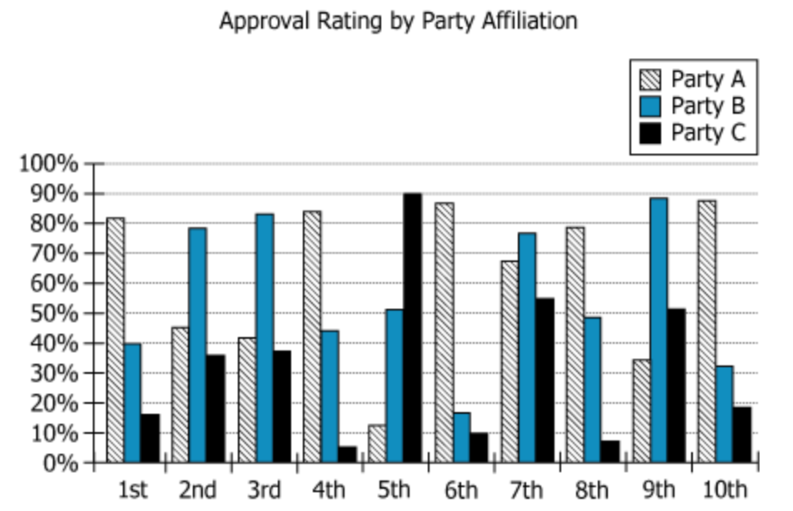
Nation X is a democratic country with three major political parties. Researchers conducted a study that compared the popular approval ratings of Nation X’s first 10 leaders among people who identify themselves as being members of one of the three parties. The researchers found that each leader had the highest approval rating from people who identified themselves as being members of the same party as that leader. The results of the researchers’ study are shown in the graph.
Select from each drop-down menu the option that creates the most accurate statement based on the information provided.
According to the information provided of the first 10 leaders were members of Party A, and of those leaders had approval ratings higher than 50% from members of each of the three parties.

GMAT-Club-Forum-5py6mnk1.png [ 127.66 KiB | Viewed 9481 times ]

GMAT-Club-Forum-6czz3pcx.png [ 156.19 KiB | Viewed 7165 times ]
Nation X is a democratic country with three major political parties. Researchers conducted a study that compared the popular approval ratings of Nation X’s first 10 leaders among people who identify themselves as being members of one of the three parties. The researchers found that each leader had the highest approval rating from people who identified themselves as being members of the same party as that leader. The results of the researchers’ study are shown in the graph.
Select from each drop-down menu the option that creates the most accurate statement based on the information provided.
According to the information provided of the first 10 leaders were members of Party A, and of those leaders had approval ratings higher than 50% from members of each of the three parties.
Attachment:
GMAT-Club-Forum-5py6mnk1.png [ 127.66 KiB | Viewed 9481 times ]
Attachment:
GMAT-Club-Forum-6czz3pcx.png [ 156.19 KiB | Viewed 7165 times ]
ShowHide Answer
Official Answer
Dropdown 1: 5
Dropdown 2: none
Need more Tests to Practice?
GMAT Club Tests give expert solutions for every question in full and sectional GMAT Focus mocks.
Learn more →

Kudos
Bookmarks
At first glance, this question may seem daunting due to its complexity. However, it transforms into a straightforward task when you fully grasp the given information. Watch this solution to see how:
- Careful reading and interpretation of the data can simplify the problem significantly.
- Identifying key relationships within the information can lead to quick deductions.


Kudos
Bookmarks
guddo
Nation X is a democratic country with three major political parties. Researchers conducted a study that compared the popular approval ratings of Nation X’s first 10 leaders among people who identify themselves as being members of one of the three parties. The researchers found that each leader had the highest approval rating from people who identified themselves as being members of the same party as that leader. The results of the researchers’ study are shown in the graph.
Scan the para and make a note that the leader belongs to the party for which the column is the highest
Select from each drop-down menu the option that creates the most accurate statement based on the information provided.
According to the information provided __1__ of the first 10 leaders were members of Party A, and __2__ of those leaders had approval ratings higher than 50% from members of each of the three parties.
1. Members of Party A: We know the highest ratings, that is the highest column, gives the party of the leaders. Therefore, all the leaders that have columns filled up with slant lines as the highest are from Party A.
1st, 4th, 6th, 8th and 10th are leaders from Party A, so answer is 5.
2. Approval Ratings higher than 50% from all three parties: Now, you have to select out of these 5 leaders from Party A those who have approval ratings higher than 50% from members of each of the three parties.
Scan the graph for the leaders 1st, 4th, 6th, 8th and 10th who have all three columns greater than 50%. Just draw an imaginary horizontal line from 50%.
All these leaders have an approval rating of higher than 50% from only their own party as the other two columns, the blue colred and the black colored ones, are below 50%. Thus, NONE is the answer.
Attachment:
GMAT-Club-Forum-syany13s.png [ 127.66 KiB | Viewed 9009 times ]