Events & Promotions
|
|

GMAT Club Daily Prep
Thank you for using the timer - this advanced tool can estimate your performance and suggest more practice questions. We have subscribed you to Daily Prep Questions via email.
Customized
for You
Track
Your Progress
Practice
Pays
Not interested in getting valuable practice questions and articles delivered to your email? No problem, unsubscribe here.
- Nov 20
07:30 AM PST
-08:30 AM PST
Learn what truly sets the UC Riverside MBA apart and how it helps in your professional growth - Nov 22
11:00 AM IST
-01:00 PM IST
Do RC/MSR passages scare you? e-GMAT is conducting a masterclass to help you learn – Learn effective reading strategies Tackle difficult RC & MSR with confidence Excel in timed test environment - Nov 23
11:00 AM IST
-01:00 PM IST
Attend this free GMAT Algebra Webinar and learn how to master the most challenging Inequalities and Absolute Value problems with ease. - Nov 25
10:00 AM EST
-11:00 AM EST
Prefer video-based learning? The Target Test Prep OnDemand course is a one-of-a-kind video masterclass featuring 400 hours of lecture-style teaching by Scott Woodbury-Stewart, founder of Target Test Prep and one of the most accomplished GMAT instructors.
So you're like me and hate inequalities. I've come up with a way to determine what an equality looks like on a graph without plugging in points or solving any math.
Most inequalities look like this:
±x±y<±k OR ±x±y>±k where k is a constant
This is important to know, because each sign in the equality will tell you something important about the graph.
+x indicates you keep EVERYTHING normal (I'll explain later)
+y indicates a NEGATIVE slope
< indicates you shade to the left (<---)
+k indicates the x-intercept is positive (to the right of the origin)
-x indicates you FLIP EVERYTHING (slope, direction of shading, x-int)
-y indicates POSITIVE slope
> indicates you shade to the RIGHT (--->)
-k indicates the x-intercept is negative
Example:
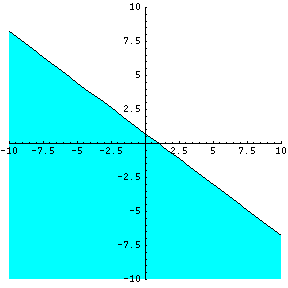
3x+4y<3

1.gif [ 1.87 KiB | Viewed 27365 times ]
You look at +3x and know you don't have to do anything with that since it's positive.
+4y indicates the slope is NEGATIVE (it's the opposite of +)
< indicates you shade LEFT of the line
and +3 indicates the x-int is to the RIGHT of the origin
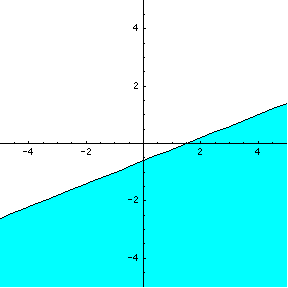
-2x+5y<-3

2.gif [ 1.59 KiB | Viewed 27260 times ]
-2x means everything gets REVERSED! Like opposite day...
that means +5y (which originally indicates a negative slope) is now a POSITIVE slope
and < means you shade to the RIGHT (not the left as usual)
and -3 means the x-int is POSITIVE (not negative, since x is negative)
Got it?
It's a little something to memorize, but I believe it would help a lot in combination with Walker's Graphic Approach located here: https://gmatclub.com/forum/7-t68037. I think it would definitely save a lot of time when working on some DS problems, which are KNOWN to have tons of inequalities.
Tell me what you think. This is my first post, so go easy on me I can do more examples if you need!
If you're looking for a tool to create graphs as an image, you can use this website:
https://www.hostsrv.com/webmab/app1/MSP/ ... s&s3=basic
Just plug in the inequation/equation and generate. Then save your pic!
Most inequalities look like this:
±x±y<±k OR ±x±y>±k where k is a constant
This is important to know, because each sign in the equality will tell you something important about the graph.
+x indicates you keep EVERYTHING normal (I'll explain later)
+y indicates a NEGATIVE slope
< indicates you shade to the left (<---)
+k indicates the x-intercept is positive (to the right of the origin)
-x indicates you FLIP EVERYTHING (slope, direction of shading, x-int)
-y indicates POSITIVE slope
> indicates you shade to the RIGHT (--->)
-k indicates the x-intercept is negative
Example:
3x+4y<3
Attachment:
1.gif [ 1.87 KiB | Viewed 27365 times ]
+4y indicates the slope is NEGATIVE (it's the opposite of +)
< indicates you shade LEFT of the line
and +3 indicates the x-int is to the RIGHT of the origin
-2x+5y<-3
Attachment:
2.gif [ 1.59 KiB | Viewed 27260 times ]
that means +5y (which originally indicates a negative slope) is now a POSITIVE slope
and < means you shade to the RIGHT (not the left as usual)
and -3 means the x-int is POSITIVE (not negative, since x is negative)
Got it?
It's a little something to memorize, but I believe it would help a lot in combination with Walker's Graphic Approach located here: https://gmatclub.com/forum/7-t68037. I think it would definitely save a lot of time when working on some DS problems, which are KNOWN to have tons of inequalities.
Tell me what you think. This is my first post, so go easy on me
Nach0
If you're looking for a tool to create graphs as an image, you can use this website:
https://www.hostsrv.com/webmab/app1/MSP/ ... s&s3=basic
Just plug in the inequation/equation and generate. Then save your pic!
Kudos
Bookmarks
This is a very good post. Quick solving is the key in GMAT and this certainly goes a long way in helping!
There is one thing I would like to add though.
Suppose we encounter an equation in which we are required to multiply or divide by the variable x or y (as in the question explained by walker in his topic dealing with graphs), then we have to simply break it up into two cases and solve it.
Let me take the following equation as an example (those of you who have gone through walkers post might recognize this equation):
\((x/y) > 2\)
now in order to plot it using the 'quick' approach, we have to break it up in to two cases.
1) When y is positive:
\(x > 2y\) which can be written as \(x - 2y > 0\)
This case gives us the required line. However, it only gives us the region for y>0.
To find the region for y<0, we need case 2.
2) When y is negative:
\((x/-y) > 2\) , now multiply both sides with -1 and simplify.
we get \(x + 2y < 0\)
This case gives us the region for all y<0.
Thus from the above two cases, we infer that:
1) For all positive values of y, the region lies to the right (as given by the equation in case 1).
2) For all negative values of y, the region lies to the left (as given by the equation in case 2).
Note: x = 0 is the line above which all y is positive and below which all y is negative. Thus, it will act as a boundary line. Also, while plotting the line, we should think of an '=' present instead of the inequality in the original equation. The inequality comes into the picture when we want to plot the region.
Attachments
tarek99.png [ 17.7 KiB | Viewed 17006 times ]
General Discussion


