Last visit was: 18 Nov 2025, 17:34 It is currently 18 Nov 2025, 17:34
Close
GMAT Club Daily Prep
Thank you for using the timer - this advanced tool can estimate your performance and suggest more practice questions. We have subscribed you to Daily Prep Questions via email.

Customized
for You

we will pick new questions that match your level based on your Timer History

Track
Your Progress

every week, we’ll send you an estimated GMAT score based on your performance

Practice
Pays

we will pick new questions that match your level based on your Timer History
Not interested in getting valuable practice questions and articles delivered to your email? No problem, unsubscribe here.
Close
Request Expert Reply
Confirm Cancel
User avatar
chetan2u
User avatar
GMAT Expert
Joined: 02 Aug 2009
Last visit: 15 Nov 2025
Posts: 11,238
Own Kudos:
43,696
 [22]
Given Kudos: 335
Status:Math and DI Expert
Location: India
Concentration: Human Resources, General Management
GMAT Focus 1: 735 Q90 V89 DI81
Products:
Expert
Expert reply
GMAT Focus 1: 735 Q90 V89 DI81
Posts: 11,238
Kudos: 43,696
 [22]
2
Kudos
Add Kudos
20
Bookmarks
Bookmark this Post
Most Helpful Reply
User avatar
lucaswerner1
Joined: 03 Apr 2024
Last visit: 05 Apr 2024
Posts: 1
Own Kudos:
6
 [6]
Given Kudos: 1
Posts: 1
Kudos: 6
 [6]
5
Kudos
Add Kudos
1
Bookmarks
Bookmark this Post
General Discussion
User avatar
chetan2u
User avatar
GMAT Expert
Joined: 02 Aug 2009
Last visit: 15 Nov 2025
Posts: 11,238
Own Kudos:
Given Kudos: 335
Status:Math and DI Expert
Location: India
Concentration: Human Resources, General Management
GMAT Focus 1: 735 Q90 V89 DI81
Products:
Expert
Expert reply
GMAT Focus 1: 735 Q90 V89 DI81
Posts: 11,238
Kudos: 43,696
Kudos
Add Kudos
Bookmarks
Bookmark this Post
User avatar
byebyebye
Joined: 02 Oct 2023
Last visit: 06 Jun 2024
Posts: 10
Own Kudos:
Given Kudos: 5
Posts: 10
Kudos: 1
Kudos
Add Kudos
Bookmarks
Bookmark this Post
lucaswerner1
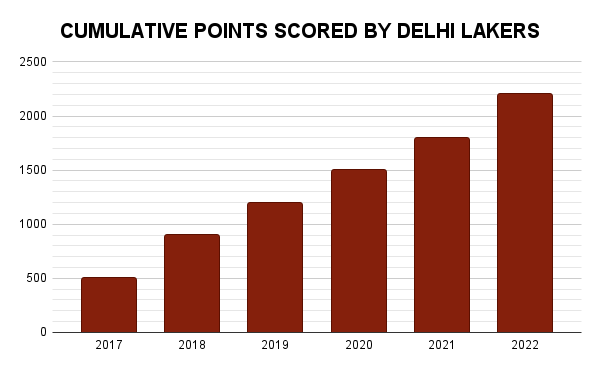
The trick is that the graph is cumulative, so it's interesting to separate the points earned per year, as follows:
2017: 500
2018: 400
2019: 300
2020: 300
2021: 300
2022: 400

So, as we have in the statement, the matches are constant in all these years. Therefore, we can conclude that 2017 had the highest average of points per match.

Now, in the second part of the question, we should get 500/x (average of points per match in 2017) and divide for 2200/6x (average of points per match over the whole period). And we get a ratio of ~1.36, so the average per match in 2017 was ~1.36 times the average per match over the whole period.
­
Isn't the second part saying that we need to take avg of all the graph numbers and that will be whatever times of the earlier average?
please correct me if i am wrong because i sat and calculated the whole avg it was 1350
User avatar
chetan2u
User avatar
GMAT Expert
Joined: 02 Aug 2009
Last visit: 15 Nov 2025
Posts: 11,238
Own Kudos:
43,696
 [1]
Given Kudos: 335
Status:Math and DI Expert
Location: India
Concentration: Human Resources, General Management
GMAT Focus 1: 735 Q90 V89 DI81
Products:
Expert
Expert reply
GMAT Focus 1: 735 Q90 V89 DI81
Posts: 11,238
Kudos: 43,696
 [1]
1
Kudos
Add Kudos
Bookmarks
Bookmark this Post
byebyebye

lucaswerner1
The trick is that the graph is cumulative, so it's interesting to separate the points earned per year, as follows:
2017: 500
2018: 400
2019: 300
2020: 300
2021: 300
2022: 400

So, as we have in the statement, the matches are constant in all these years. Therefore, we can conclude that 2017 had the highest average of points per match.

Now, in the second part of the question, we should get 500/x (average of points per match in 2017) and divide for 2200/6x (average of points per match over the whole period). And we get a ratio of ~1.36, so the average per match in 2017 was ~1.36 times the average per match over the whole period.
­
Isn't the second part saying that we need to take avg of all the graph numbers and that will be whatever times of the earlier average?
please correct me if i am wrong because i sat and calculated the whole avg it was 1350
­We have to work out the average for entire period. But the column shown against each year is the cumulative total till that year, that is, it is the sum of the points till that year.
Thus, the column against 2022 gives you total points in all matches between 2017 and 2022, both inclusive. Just divide by total matches to get average.
User avatar
chetan2u
User avatar
GMAT Expert
Joined: 02 Aug 2009
Last visit: 15 Nov 2025
Posts: 11,238
Own Kudos:
Given Kudos: 335
Status:Math and DI Expert
Location: India
Concentration: Human Resources, General Management
GMAT Focus 1: 735 Q90 V89 DI81
Products:
Expert
Expert reply
GMAT Focus 1: 735 Q90 V89 DI81
Posts: 11,238
Kudos: 43,696
Kudos
Add Kudos
Bookmarks
Bookmark this Post
lucaswerner1
The trick is that the graph is cumulative, so it's interesting to separate the points earned per year, as follows:
2017: 500
2018: 400
2019: 300
2020: 300
2021: 300
2022: 400

So, as we have in the statement, the matches are constant in all these years. Therefore, we can conclude that 2017 had the highest average of points per match.

Now, in the second part of the question, we should get 500/x (average of points per match in 2017) and divide for 2200/6x (average of points per match over the whole period). And we get a ratio of ~1.36, so the average per match in 2017 was ~1.36 times the average per match over the whole period.
­Great work. I made this question with cumulative total so as to make it challenging. The timer stats of just 20% getting it right proves it to be tricky.

So, a great work on getting it correct.
User avatar
Vinit800HBS
Joined: 29 Dec 2018
Last visit: 18 Nov 2025
Posts: 91
Own Kudos:
237
 [1]
Given Kudos: 195
Location: India
GRE 1: Q170 V163
Expert
Expert reply
GRE 1: Q170 V163
Posts: 91
Kudos: 237
 [1]
1
Kudos
Add Kudos
Bookmarks
Bookmark this Post
chetan2u
chetan2u
  The cumulative points as of the end of each year from 2017 to 2022 scored by Delhi Lakers in the Basketball tournaments is given in the graph below. The number of matches played per year by Delhi Lakers over the last ten years from 2014 has been constant.
 
Attachment:
CUMULATIVE POINTS SCORED BY DELHI LAKERS.png

Based on the graph and the information above, we can say that the average per match was highest in , which was  the average per match over the entire period.
­ 


­Is there some misprint in the red part? If not, I believe the answers to both the questions are incorrect.

The 2017 number will be the cumulative of 2014-2017 period. So, we cannot be certain whether Delhi Lakers scored 500 points in 2017 itself or merely 100 points and the rest of the 400 points were cumulative from the previous years. This changes the answer significantly for the first dropdown.

As for the second dropdown, average for the entire period should be calculated by dividing the 2022 number (2023 actually if we consider 10 years from 2014) by 10 and not by 6 unless the question is refering to the entire period as period that is given in the graph only.­
User avatar
Gemmie
Joined: 19 Dec 2021
Last visit: 18 Nov 2025
Posts: 491
Own Kudos:
Given Kudos: 76
Location: Viet Nam
Concentration: Technology, Economics
GMAT Focus 1: 695 Q87 V84 DI83
GPA: 3.55
GMAT Focus 1: 695 Q87 V84 DI83
Posts: 491
Kudos: 426
Kudos
Add Kudos
Bookmarks
Bookmark this Post
­Based on the graph and the information above, we can say that the average per match was highest in [2017], which was [1.5 times] the average per match over the entire period.

The column in each year show the cumulative points since 2017
=> Point for each year after 2017 = Column of thiss year - Column of last year

Each leading (space btw 2 lines) is 100

2017: 500
2018: 400 
2019: 300
2020: 300
2021: 300
2022: 400

=> 2017 have the highest avg point

Surely the avg of the entired period can be calculated => NOT 'cannot be determined'

The highest must be higher than the avg of the period
=> 1.5 times is only possible answer
User avatar
kanikaa9
Joined: 19 Aug 2023
Last visit: 02 Jul 2025
Posts: 97
Own Kudos:
Given Kudos: 708
Location: India
WE:Consulting (Consulting)
Posts: 97
Kudos: 51
Kudos
Add Kudos
Bookmarks
Bookmark this Post
Hi
Vinit800HBS

The question clearly says "points are from the start of 2017" and I don't think there's anything wrong with the question. I could solve comfortably with no language issues.
Vinit800HBS
chetan2u
chetan2u
The cumulative points as of the end of each year from 2017 to 2022 scored by Delhi Lakers in the Basketball tournaments is given in the graph below. The number of matches played per year by Delhi Lakers over the last ten years from 2014 has been constant.

Attachment:
CUMULATIVE POINTS SCORED BY DELHI LAKERS.png

Based on the graph and the information above, we can say that the average per match was highest in , which was the average per match over the entire period.
­


­Is there some misprint in the red part? If not, I believe the answers to both the questions are incorrect.

The 2017 number will be the cumulative of 2014-2017 period. So, we cannot be certain whether Delhi Lakers scored 500 points in 2017 itself or merely 100 points and the rest of the 400 points were cumulative from the previous years. This changes the answer significantly for the first dropdown.

As for the second dropdown, average for the entire period should be calculated by dividing the 2022 number (2023 actually if we consider 10 years from 2014) by 10 and not by 6 unless the question is refering to the entire period as period that is given in the graph only.­
­
Moderators:
Math Expert
105355 posts
496 posts