|
|

GMAT Club Daily Prep
Thank you for using the timer - this advanced tool can estimate your performance and suggest more practice questions. We have subscribed you to Daily Prep Questions via email.
Customized
for You
Track
Your Progress
Practice
Pays
Not interested in getting valuable practice questions and articles delivered to your email? No problem, unsubscribe here.
Originally posted by Sajjad1994 on 22 Feb 2021, 23:30.
Last edited by BottomJee on 03 Dec 2023, 01:36, edited 3 times in total.
Last edited by BottomJee on 03 Dec 2023, 01:36, edited 3 times in total.
Moved to new forum
Kudos
Bookmarks
Dropdown 1: 100% more
Dropdown 2: less than
Be sure to select an answer first to save it in the Error Log before revealing the correct answer (OA)!
Difficulty:
 75%
(hard)
Question Stats:
44% (01:37) correct 56%
(02:16)
wrong
  based on 914
sessions
History
Date
Time
Result
Not Attempted Yet
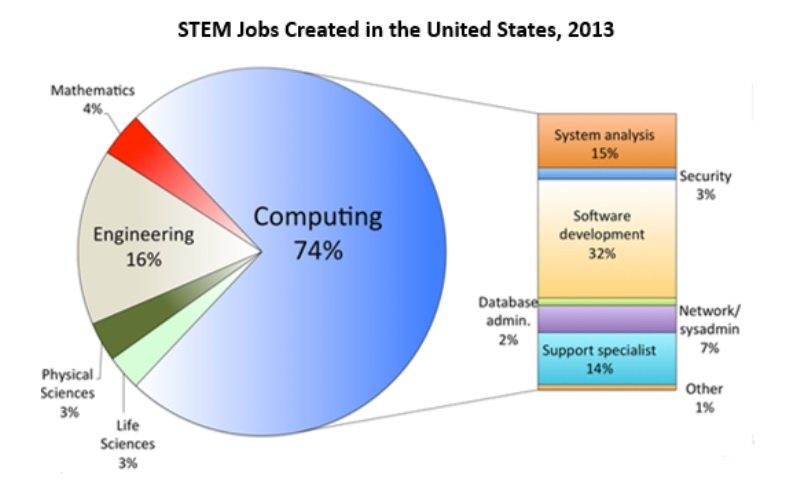
The graph below displays the proportions of U.S. jobs created in 2013 in the STEM fields.
 Based on the graph please answer the questions that follow.
1. Approximately jobs were created in Software Development than in Engineering.
2. The number of jobs created in Life Sciences and Physical Sciences was the number of jobs created in Network/Sys Admin.

3.jpg [ 54.91 KiB | Viewed 8115 times ]
1. Approximately jobs were created in Software Development than in Engineering.
2. The number of jobs created in Life Sciences and Physical Sciences was the number of jobs created in Network/Sys Admin.
Attachment:
3.jpg [ 54.91 KiB | Viewed 8115 times ]
ShowHide Answer
Official Answer
Dropdown 1: 100% more
Dropdown 2: less than
rocky620

Retired Moderator
Joined: 10 Nov 2018
Last visit: 11 May 2023
Posts: 501
Given Kudos: 229
Location: India
Concentration: General Management, Strategy
Schools: IIMA PGPX'22 IIMB EPGP'22 IIMC PGPEX'22 ISB'22
GMAT 1: 590 Q49 V22

WE:Other (Retail: E-commerce)
Kudos
Bookmarks
Approximately ___________ jobs were created in Software Development than in Engineering.
Jobs created in SD = 32%
Jobs created in Engg = 16%
So, Jobs created in SD are double than those created in Engg. Which accounts to a 100% increase. Option A
A. 100% more
B. 75% more
C. 50% more
D. 25% more
The number of jobs created in Life Sciences and Physical Sciences was ________ the number of jobs created in Network/Sys Admin.
Jobs created in LS = 3%
Jobs created in PS = 3%
Jobs created in N/S = 7%
Jobs created in N/S>Jobs created in LS+Jobs created in PS. Option B
A. more than
B. less than
The number of jobs created in Security, Software Development, and Database Administration account for approximately _________ of all Computing jobs created.
Jobs created in Security = 3%
Jobs created in SD = 32%
Jobs created in DA = 2%
Total = 37%
Jobs created in Computing = 74%
So, the jobs created in Security+SD+DA, accounts for 50% of all jobs in computing. Option C
A. 33%
B. 37%
C. 50%
Jobs created in SD = 32%
Jobs created in Engg = 16%
So, Jobs created in SD are double than those created in Engg. Which accounts to a 100% increase. Option A
A. 100% more
B. 75% more
C. 50% more
D. 25% more
The number of jobs created in Life Sciences and Physical Sciences was ________ the number of jobs created in Network/Sys Admin.
Jobs created in LS = 3%
Jobs created in PS = 3%
Jobs created in N/S = 7%
Jobs created in N/S>Jobs created in LS+Jobs created in PS. Option B
A. more than
B. less than
The number of jobs created in Security, Software Development, and Database Administration account for approximately _________ of all Computing jobs created.
Jobs created in Security = 3%
Jobs created in SD = 32%
Jobs created in DA = 2%
Total = 37%
Jobs created in Computing = 74%
So, the jobs created in Security+SD+DA, accounts for 50% of all jobs in computing. Option C
A. 33%
B. 37%
C. 50%
Kudos
Bookmarks
First question a
Second b
Third c
Posted from my mobile device
Second b
Third c
Posted from my mobile device


