Events & Promotions
|
|

GMAT Club Daily Prep
Thank you for using the timer - this advanced tool can estimate your performance and suggest more practice questions. We have subscribed you to Daily Prep Questions via email.
Customized
for You
Track
Your Progress
Practice
Pays
Not interested in getting valuable practice questions and articles delivered to your email? No problem, unsubscribe here.
- Nov 20
07:30 AM PST
-08:30 AM PST
Learn what truly sets the UC Riverside MBA apart and how it helps in your professional growth - Nov 22
11:00 AM IST
-01:00 PM IST
Do RC/MSR passages scare you? e-GMAT is conducting a masterclass to help you learn – Learn effective reading strategies Tackle difficult RC & MSR with confidence Excel in timed test environment - Nov 23
11:00 AM IST
-01:00 PM IST
Attend this free GMAT Algebra Webinar and learn how to master the most challenging Inequalities and Absolute Value problems with ease. - Nov 25
10:00 AM EST
-11:00 AM EST
Prefer video-based learning? The Target Test Prep OnDemand course is a one-of-a-kind video masterclass featuring 400 hours of lecture-style teaching by Scott Woodbury-Stewart, founder of Target Test Prep and one of the most accomplished GMAT instructors.
TargetMBA007
Joined: 22 Nov 2019
Last visit: 14 Nov 2025
Posts: 256
Given Kudos: 215
Schools: Stanford (S)
GPA: 4.0
Originally posted by TargetMBA007 on 27 Dec 2019, 19:46.
Last edited by Bunuel on 11 Jun 2024, 04:30, edited 8 times in total.
Last edited by Bunuel on 11 Jun 2024, 04:30, edited 8 times in total.
Kudos
Bookmarks
Dropdown 1: France
Dropdown 2: Russia
Be sure to select an answer first to save it in the Error Log before revealing the correct answer (OA)!
Difficulty:
 55%
(hard)
Question Stats:
65% (01:51) correct 35%
(02:21)
wrong
  based on 3587
sessions
History
Date
Time
Result
Not Attempted Yet
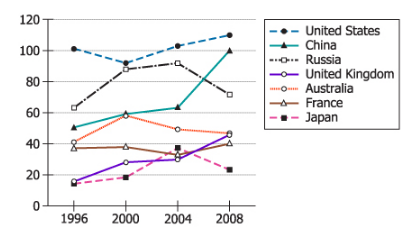
The graph shows the numbers of medals won by 7 selected countries in the Summer Olympics that were held in the years 1996, 2000, 2004, and 2008. The following statements apply only to the Summer Olympics and the countries represented in the graph.
Using the drop-down menus, create the most accurate statements based on the information provided.
The variance in the numbers of medals won is the least for .
If, for each country, the point representing the medals won in 2004 had been on the line determined by the points representing the medals won in 1996 and 2000, then the country that would have won the greatest number of medals in 2004 is .
ID: 100381

download.png [ 57.37 KiB | Viewed 32662 times ]
Attachment:
download.png [ 57.37 KiB | Viewed 32662 times ]
ShowHide Answer
Official Answer
Dropdown 1: France
Dropdown 2: Russia
TargetMBA007
Joined: 22 Nov 2019
Last visit: 14 Nov 2025
Posts: 256
Given Kudos: 215
Schools: Stanford (S)
GPA: 4.0
Kudos
Bookmarks
I had difficulty deciphering the second question here gradually figured that it means that if the trends in 1996 and 2000 had continued in 2004, who would have been the winner in 2004. As Russia is trending upwards and US is trending downwards based on the trend line formed between 1996 and 2000, Russia would have the highest point on the line in 2004.
GMATCoachBen
 Expert
Tutor
Joined: 21 Mar 2017
Last visit: 19 Nov 2025
Posts: 465
Given Kudos: 210
Status:Professional GMAT Trainer
Affiliations: GMAT Coach
Location: United States (WA)
GMAT Focus 1: 775 Q87 V90 DI88 (Online) 

GMAT 1: 760 Q50 V44

GMAT 2: 770 Q51 V44

GMAT 3: 770 Q50 V44

GMAT 4: 770 Q50 V45 (Online)

GMAT 5: 780 Q51 V48

Expert reply
Originally posted by GMATCoachBen on 09 Feb 2024, 13:42.
Last edited by GMATCoachBen on 10 Mar 2024, 21:46, edited 1 time in total.
Last edited by GMATCoachBen on 10 Mar 2024, 21:46, edited 1 time in total.
Kudos
Bookmarks
Video solution here:


